Telling your Collections’ Stories for Cultural Heritage and Museums
[Originally written in 2022, still mostly relevant in 2024]
This has been updated for 2022 and covers more topics. I’ll keep this updated in the future–let me know if there are any platforms you’d like covered!
Telling a compelling narrative through your collections’ artifacts is essential to any exhibition, and this storytelling can take full advantage of the digital format. The core principle remains the same: to find that essential narrative and human thread through your artifacts, perhaps that first drew you to them, and use curation and interpretative materials to communicate that narrative to your visitors. In a digital format, your collections’ narratives can be brought to life with interactive content such as 3d virtual tours of spaces and objects and other embedded media as they never have been before. Also, much discussion for this type of storytelling has focused on the possibilities of hypertext (maybe check out this Short Guide to Digital Humanities if interesting).
To start the survey of different potential storytelling options for digital exhibitions, it’s worthwhile to first take a look at the people who make their livelihood out of interactive digital narratives: investigative journalists that use digital media to tell their stories.
New York Times’ Visual Stories
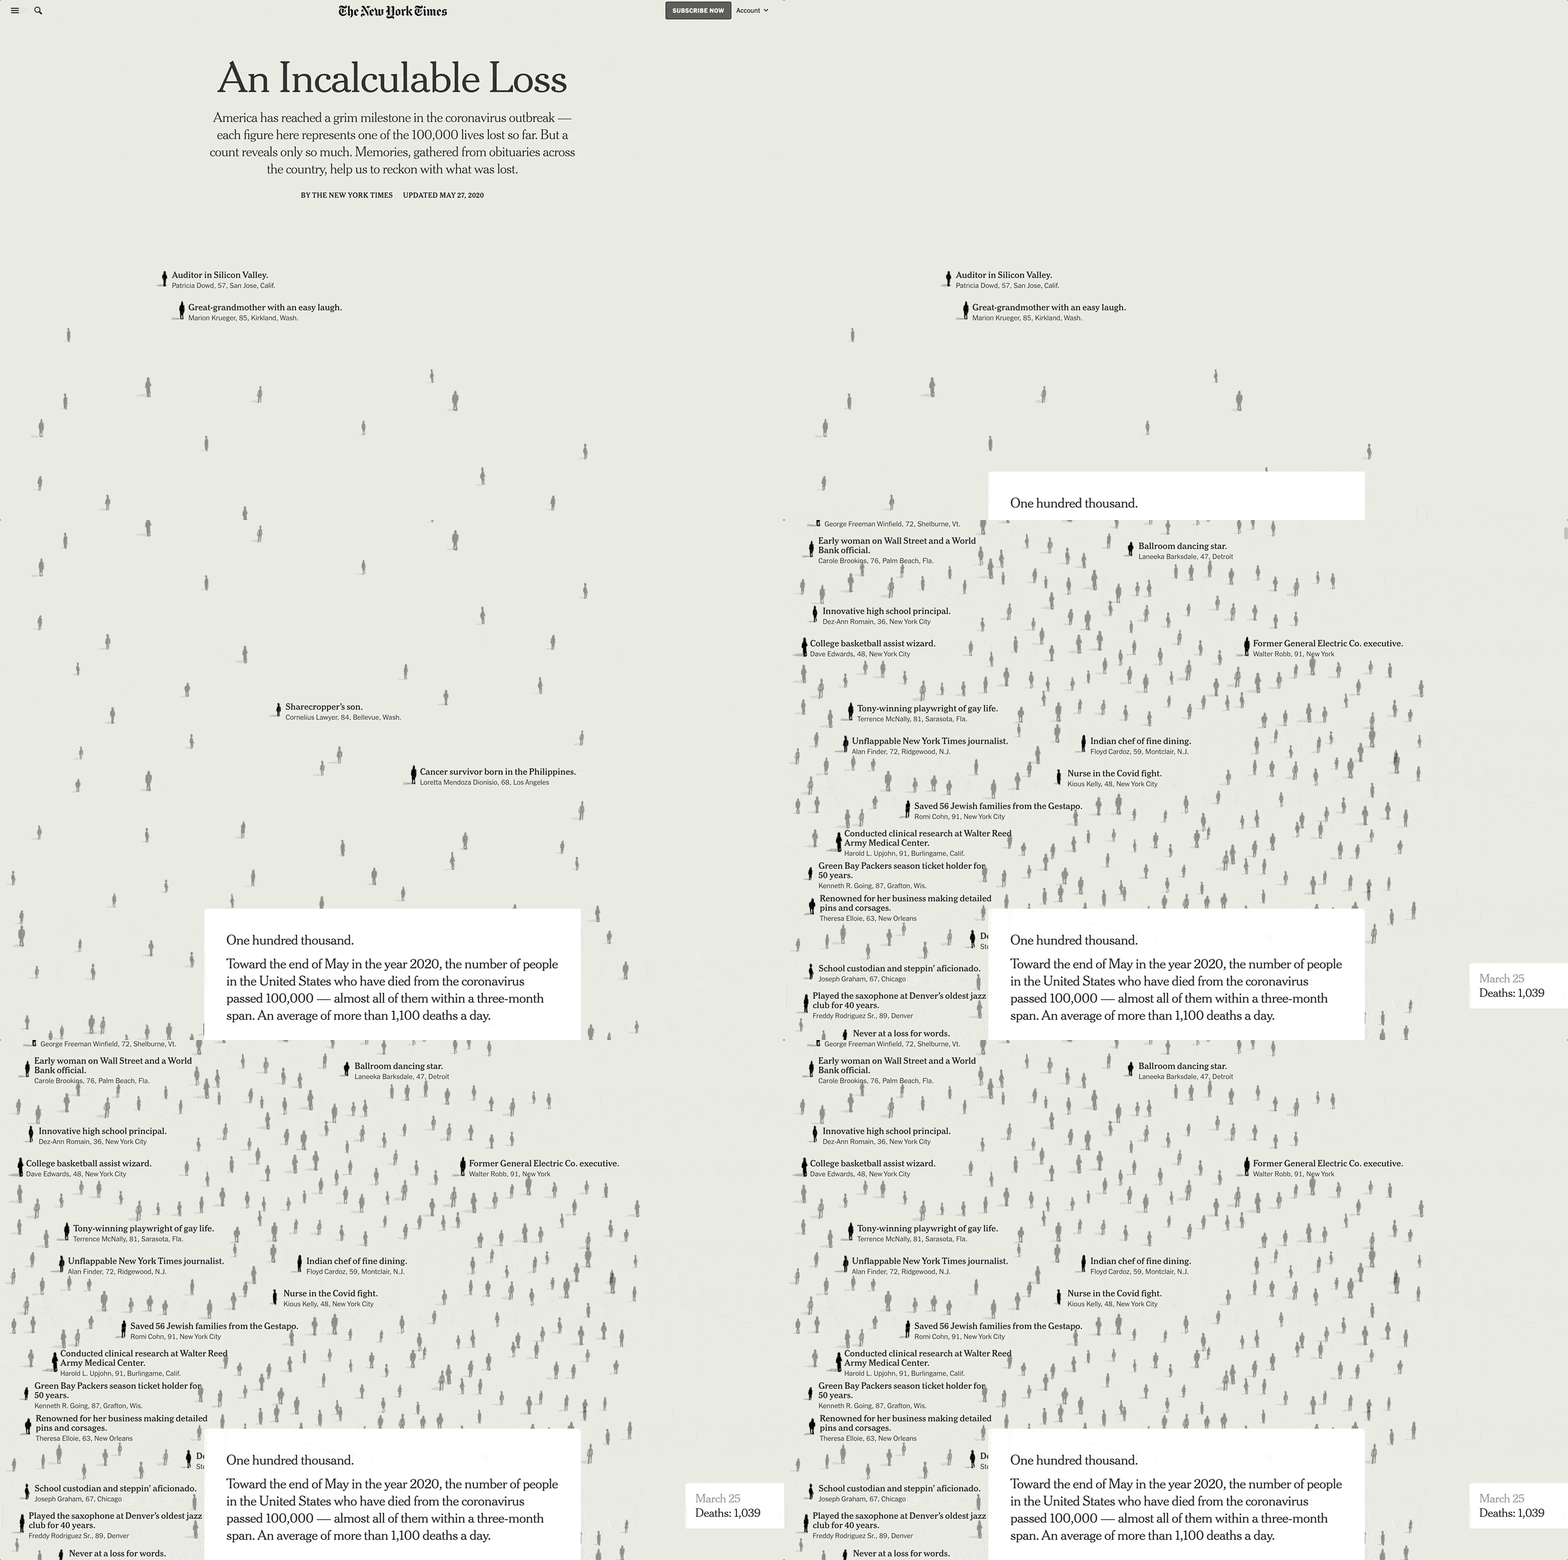
An innovator in the genre of digital storytelling, the NYT’s visual narratives are a beautifully designed and deeply creative exploration of what’s possible in an electronic medium. Because they try so many different types of digital storytelling with interactive media, data visualizations, and the like, you can survey several of their stories to inform your own writing: at the end of each year, the NYT publishes a review of the year in storytelling: 2020, 2019, 2018, 2017, 2016, 2015, 2014, 2013, 2012.
One of the classic digital narratives that many projects imitate is “Snow Fall: the Avalanche at Tunnel Creek” which seamlessly integrates text narrative with audio, video, 3d graphics, and other interactive components.
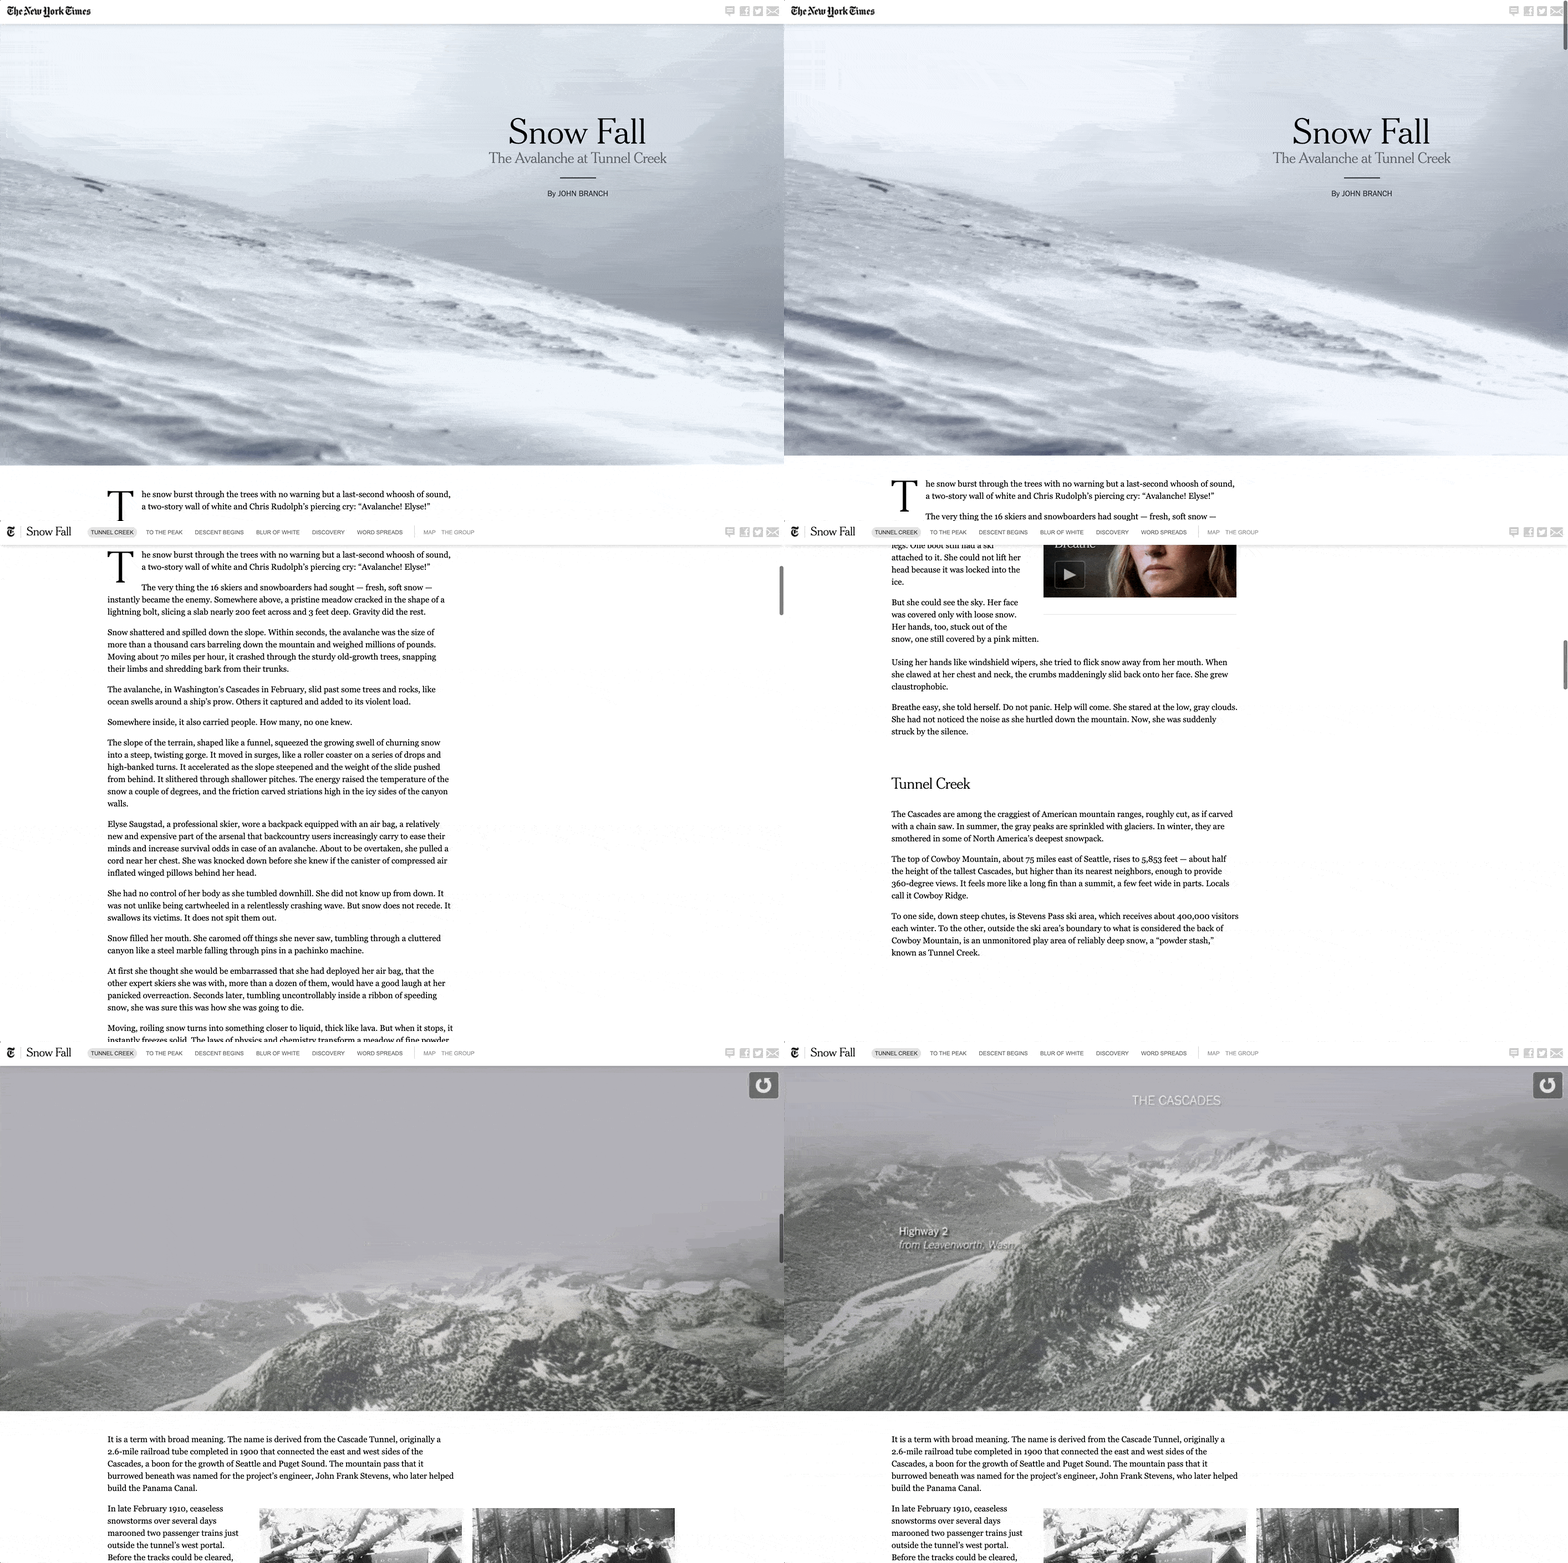
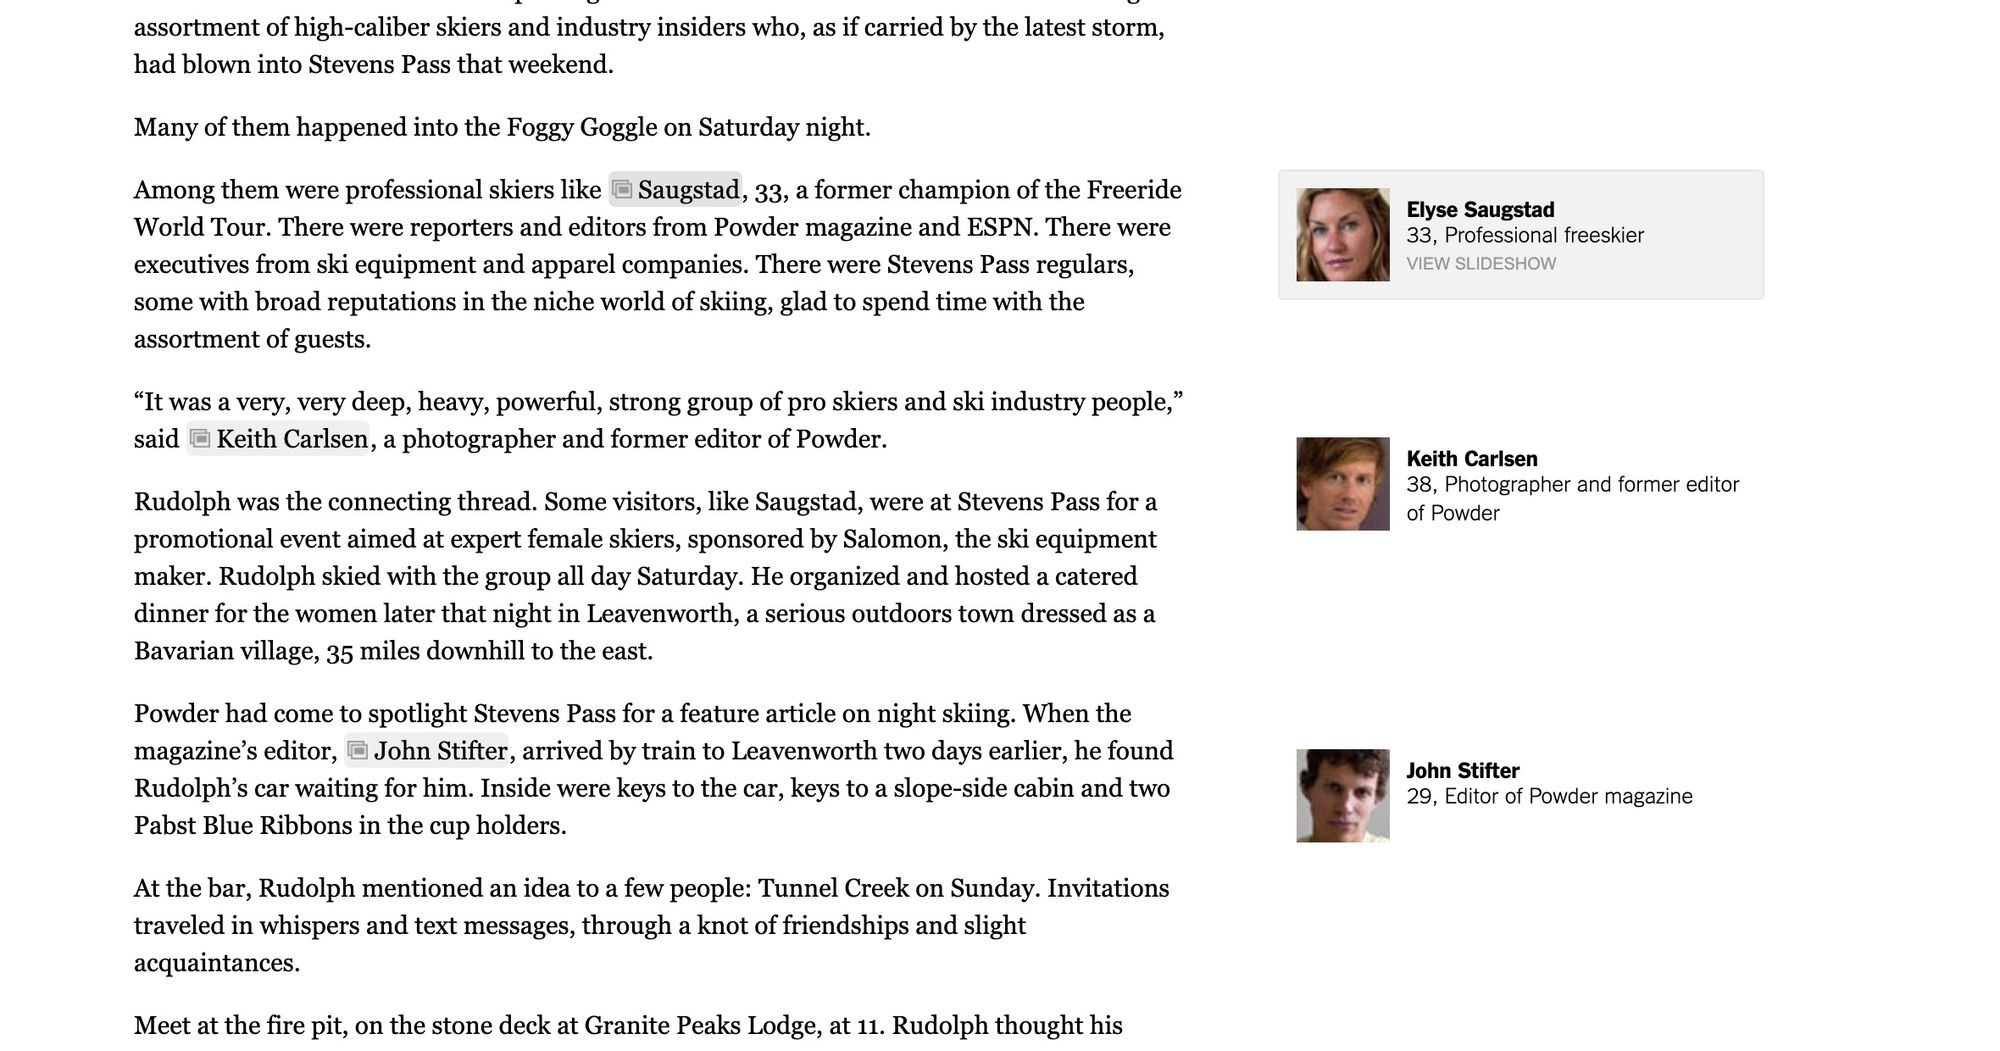
Snowfall has myriad design features to admire, and in particular, it artfully integrates multimedia annotation to the text so that users can see main characters and play audio and video clips seamlessly from the reading experience.
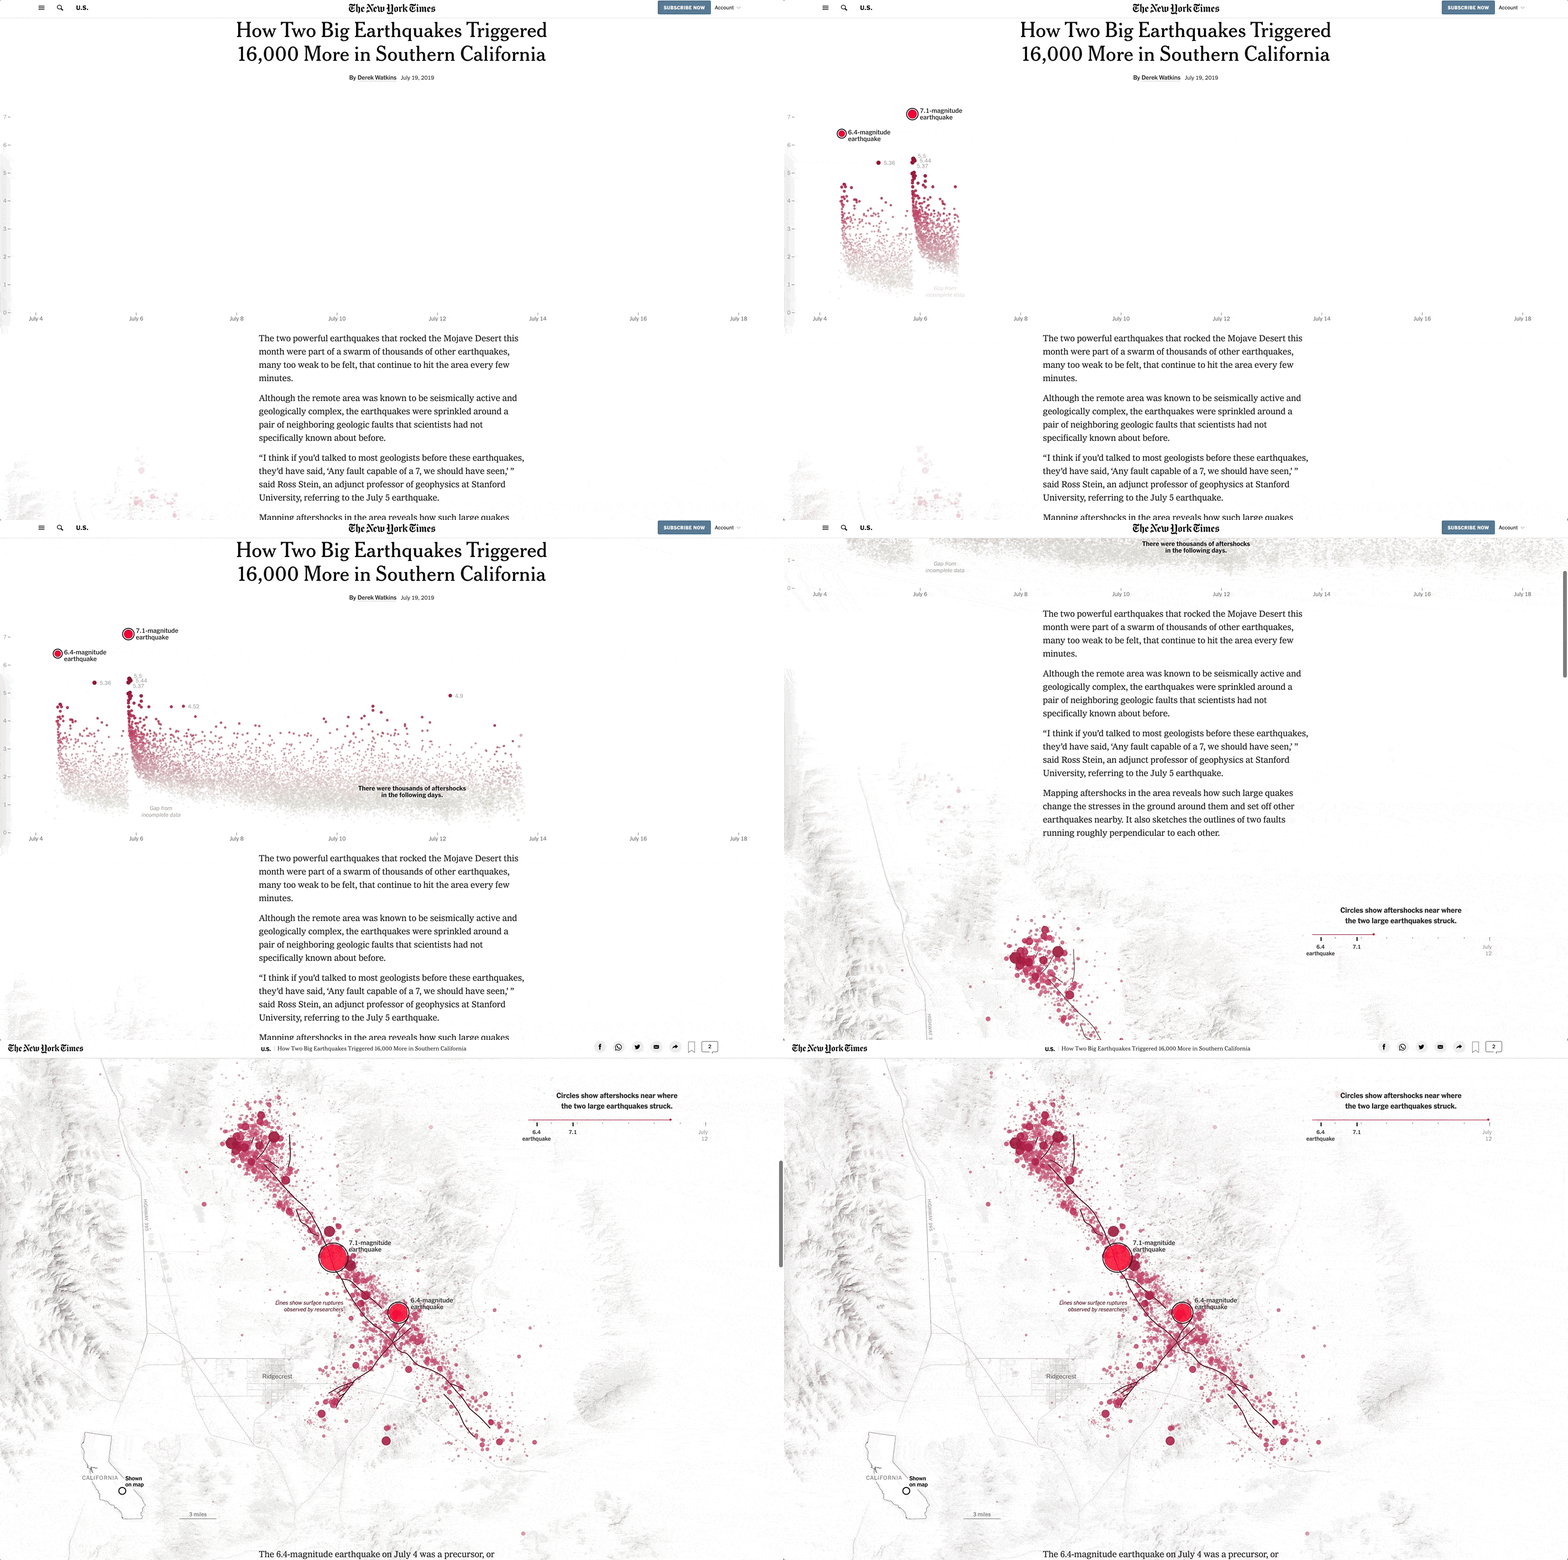
The NYT visual narratives also feature data visualizations prominently, and as a result, they also created one of the most sophisticated graphing libraries called d3, which is freely available for all to use. To learn more about d3 and see examples, check out https://d3js.org/.
Additionally, if you’d like to build beautiful and professional digital narratives for your archive, you can use the open source frameworks shared by NYT and others by checking out or pointing your developers to their GitHub page, particularly the kyt library.
Visual narratives from journalists are a broad field that deserve much more exploration, but as we focus more on heritage specifically, I’ll include links to other major news sites compilations for more resources. Most of the frameworks for building these narratives or similar projects are featured on the Github account of the relevant organization.
- NPR: https://digitalservices.npr.org/term/visual-storytelling
- Washington Post: https://www.washingtonpost.com/graphics/lede-lab/
- New Yorker: https://www.newyorker.com/culture/2020-in-review/the-year-in-new-yorker-interactive-storytelling
And so on.
National Geographic
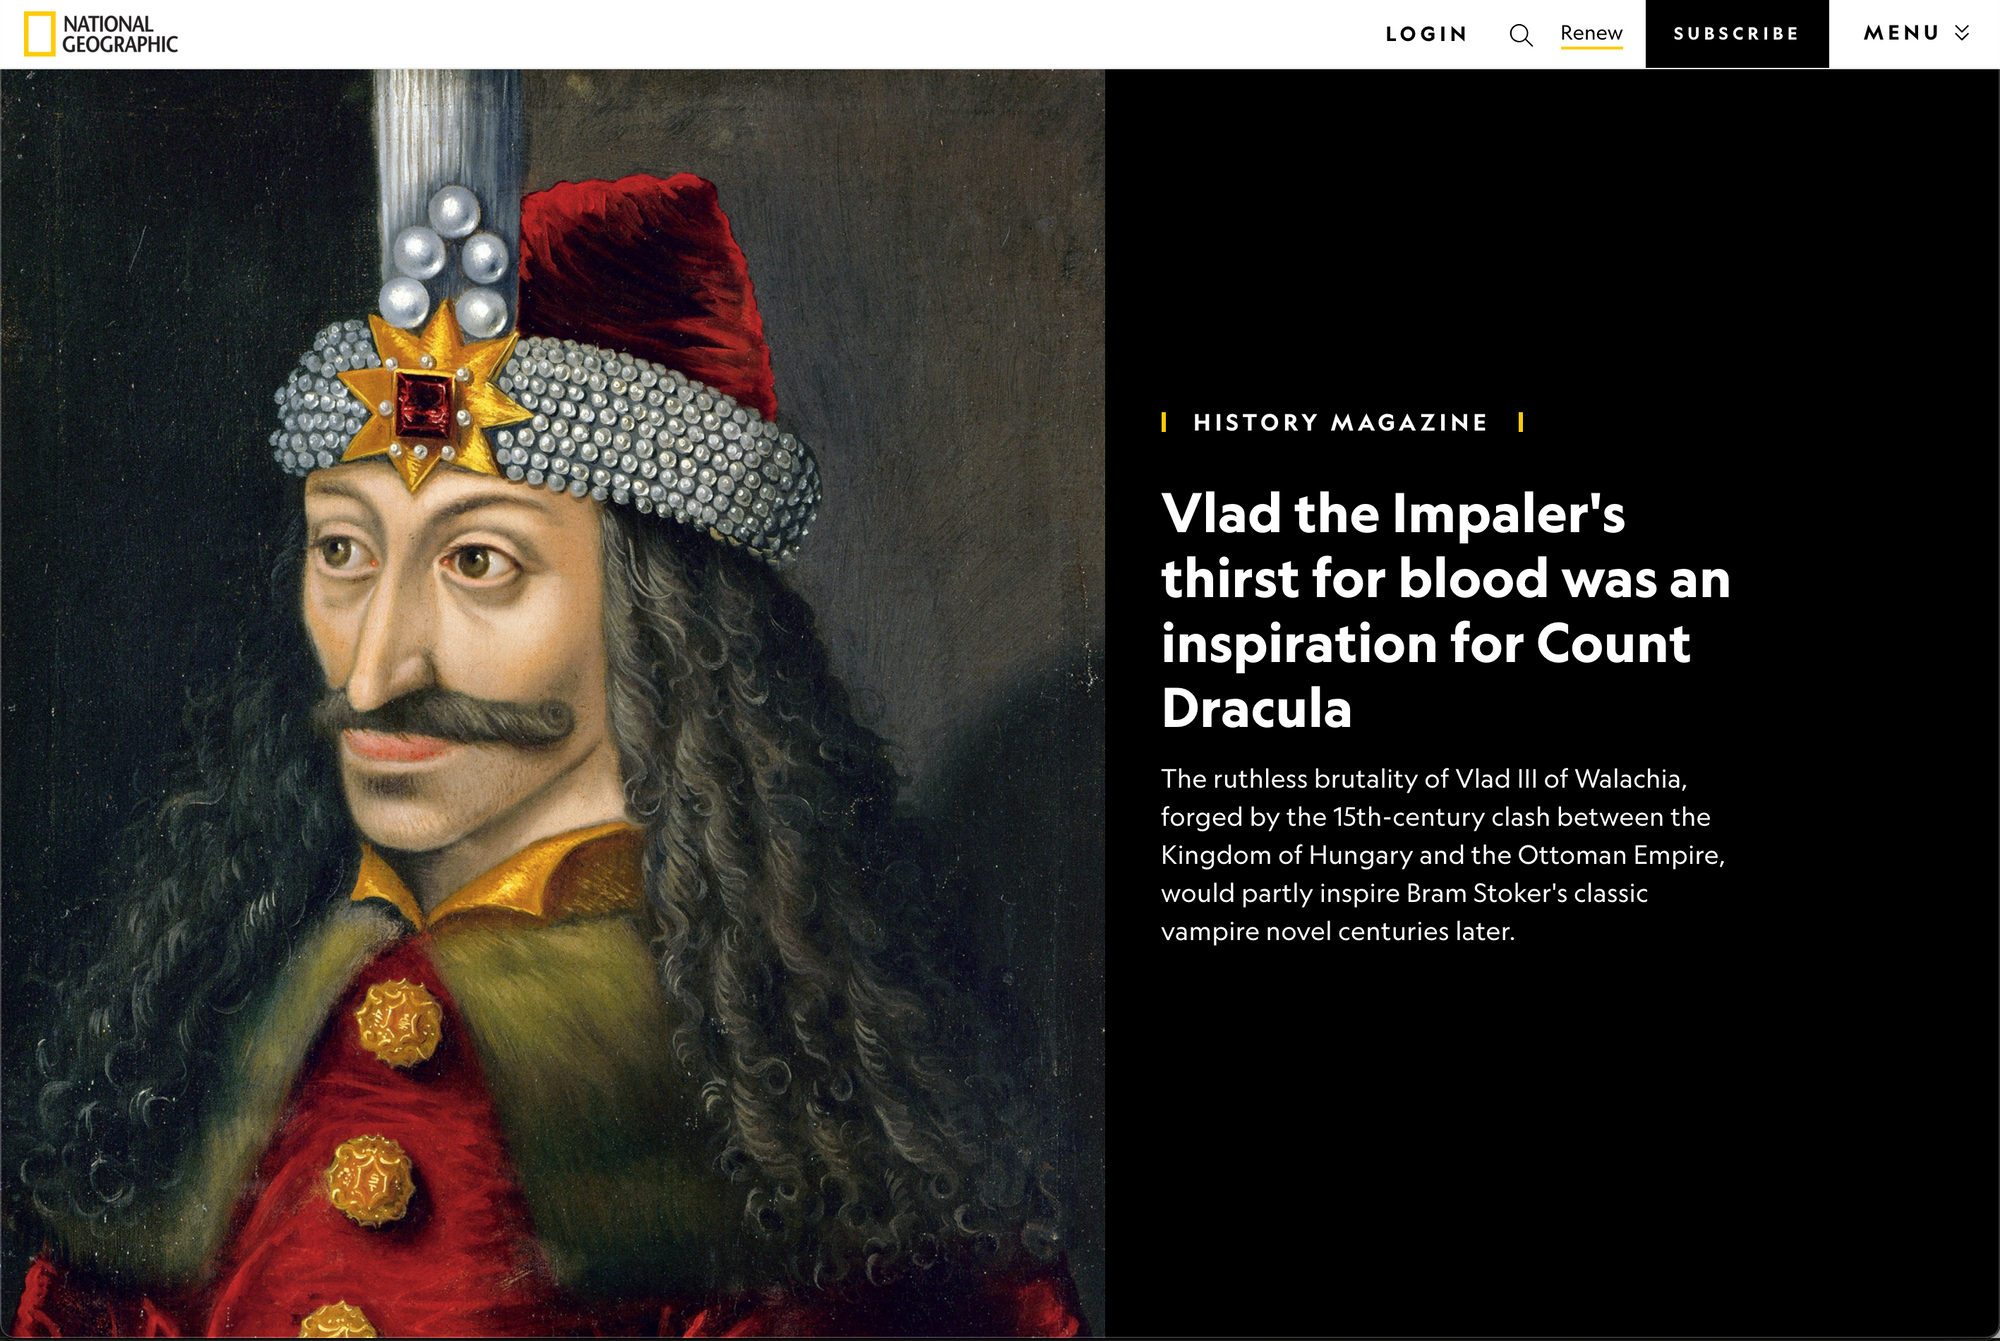
Similar to the journalistic stories, National Geographic publishes beautiful digital multimedia stories that can inform the way you tell your collections’ narratives. National Geographic’s coverage of heritage sites typically include oversized beautiful photography incorporated with in-depth narrative text that is geared a specific lifelong-learner-type audience.
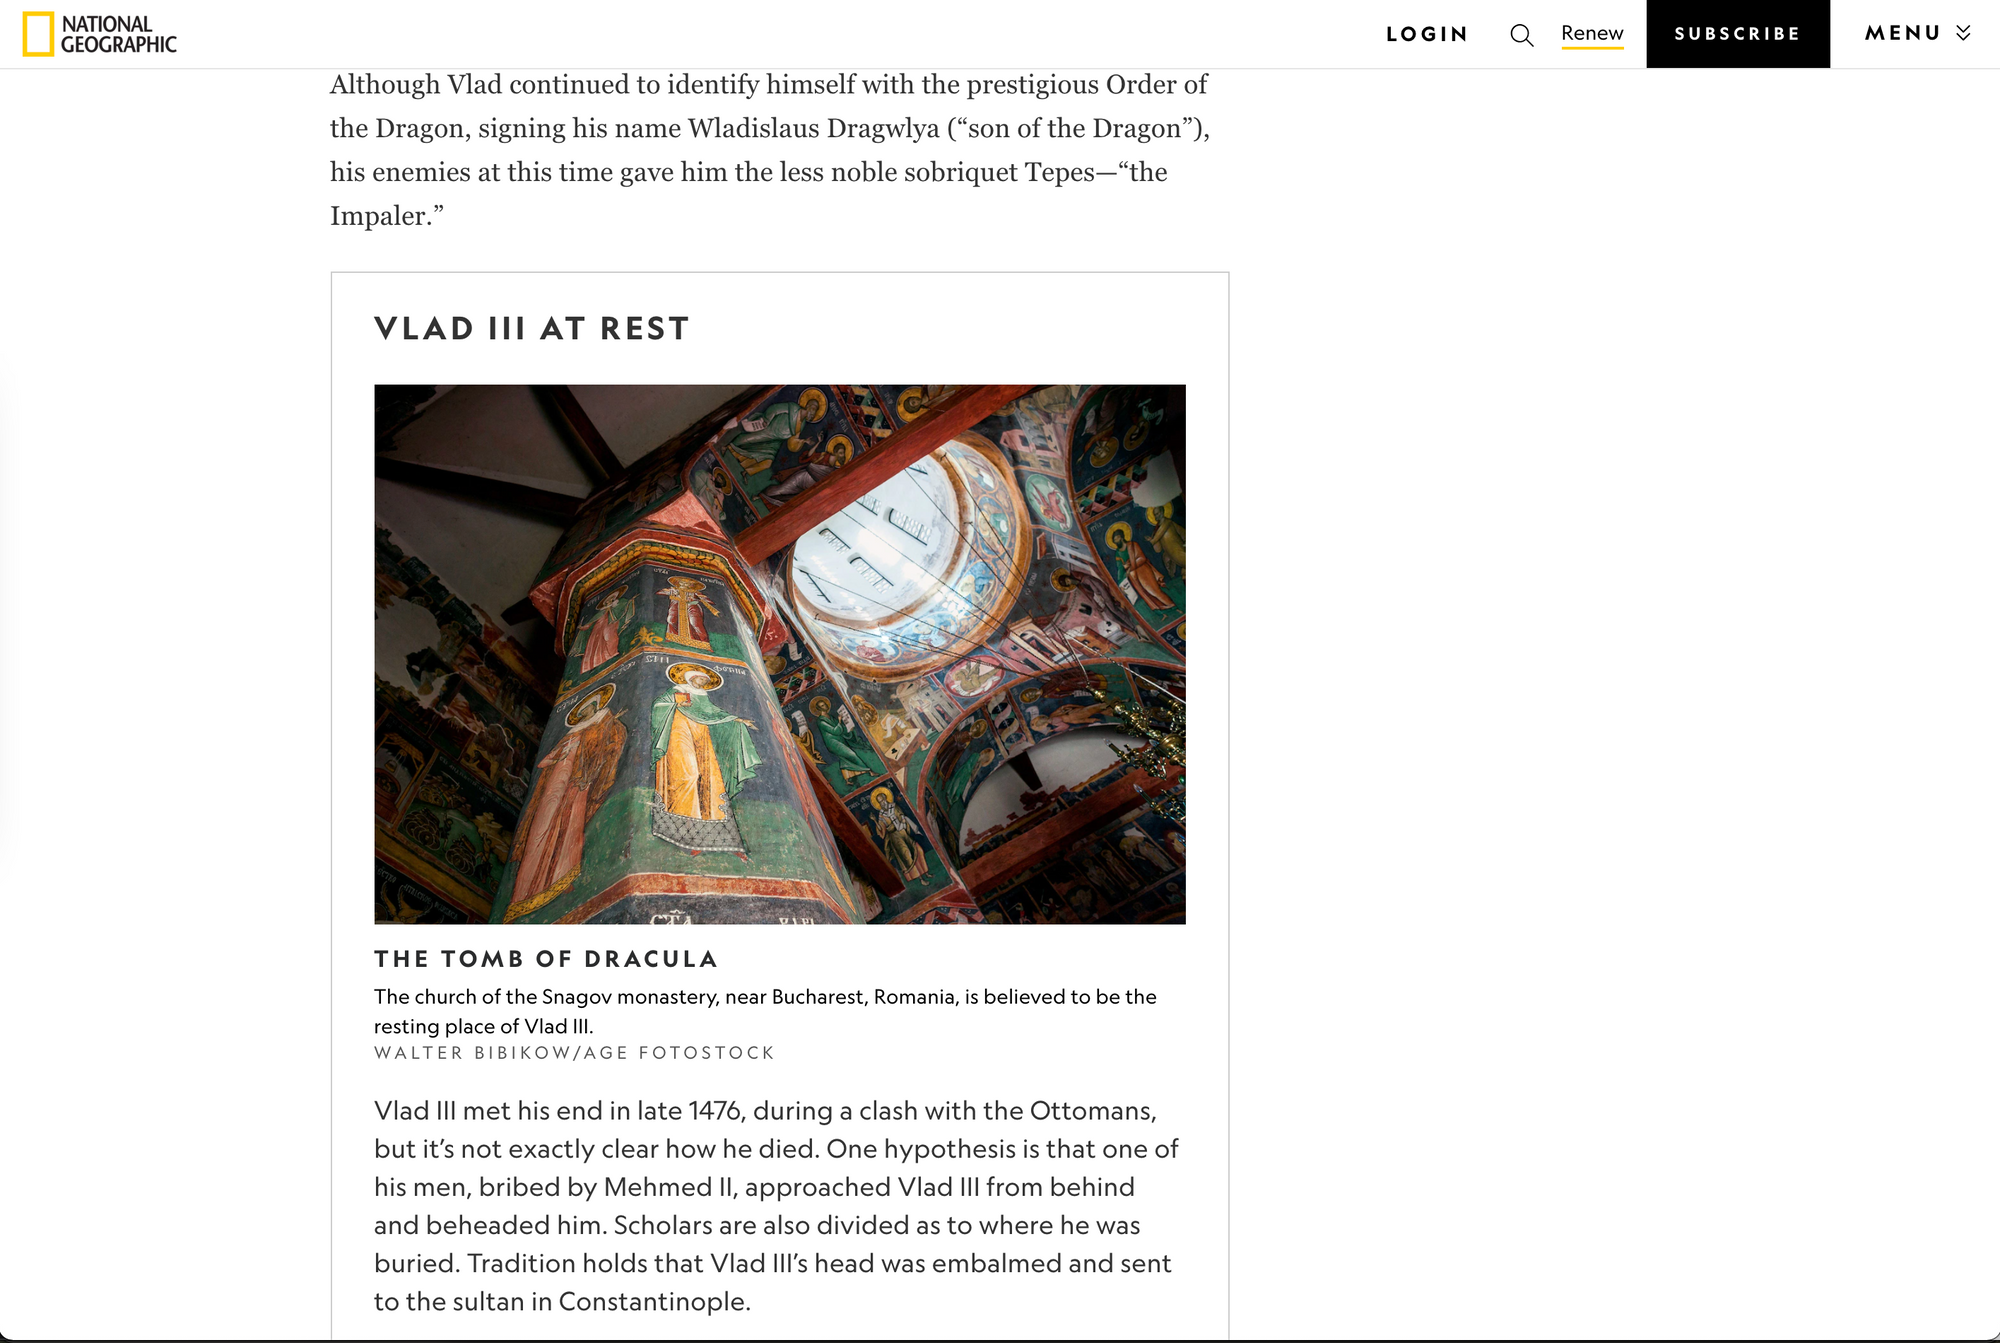
To me, it’s worthwhile especially to investigate the National Geographic storytelling for the type of audience that they focus on. This audience is associated with highly educated people who aren’t necessarily in the museum or heritage field but are interested in history and also concerned about social justice and the environment. One pitfall that many times catches museums while publishing stories in digital exhibitions is that the researchers focus on an audience of researchers while the majority of their readers and visitors are rather the National-Geographic-types.
Other visual stories on National Geographic include creative methods of showcasing artifacts and timelines.
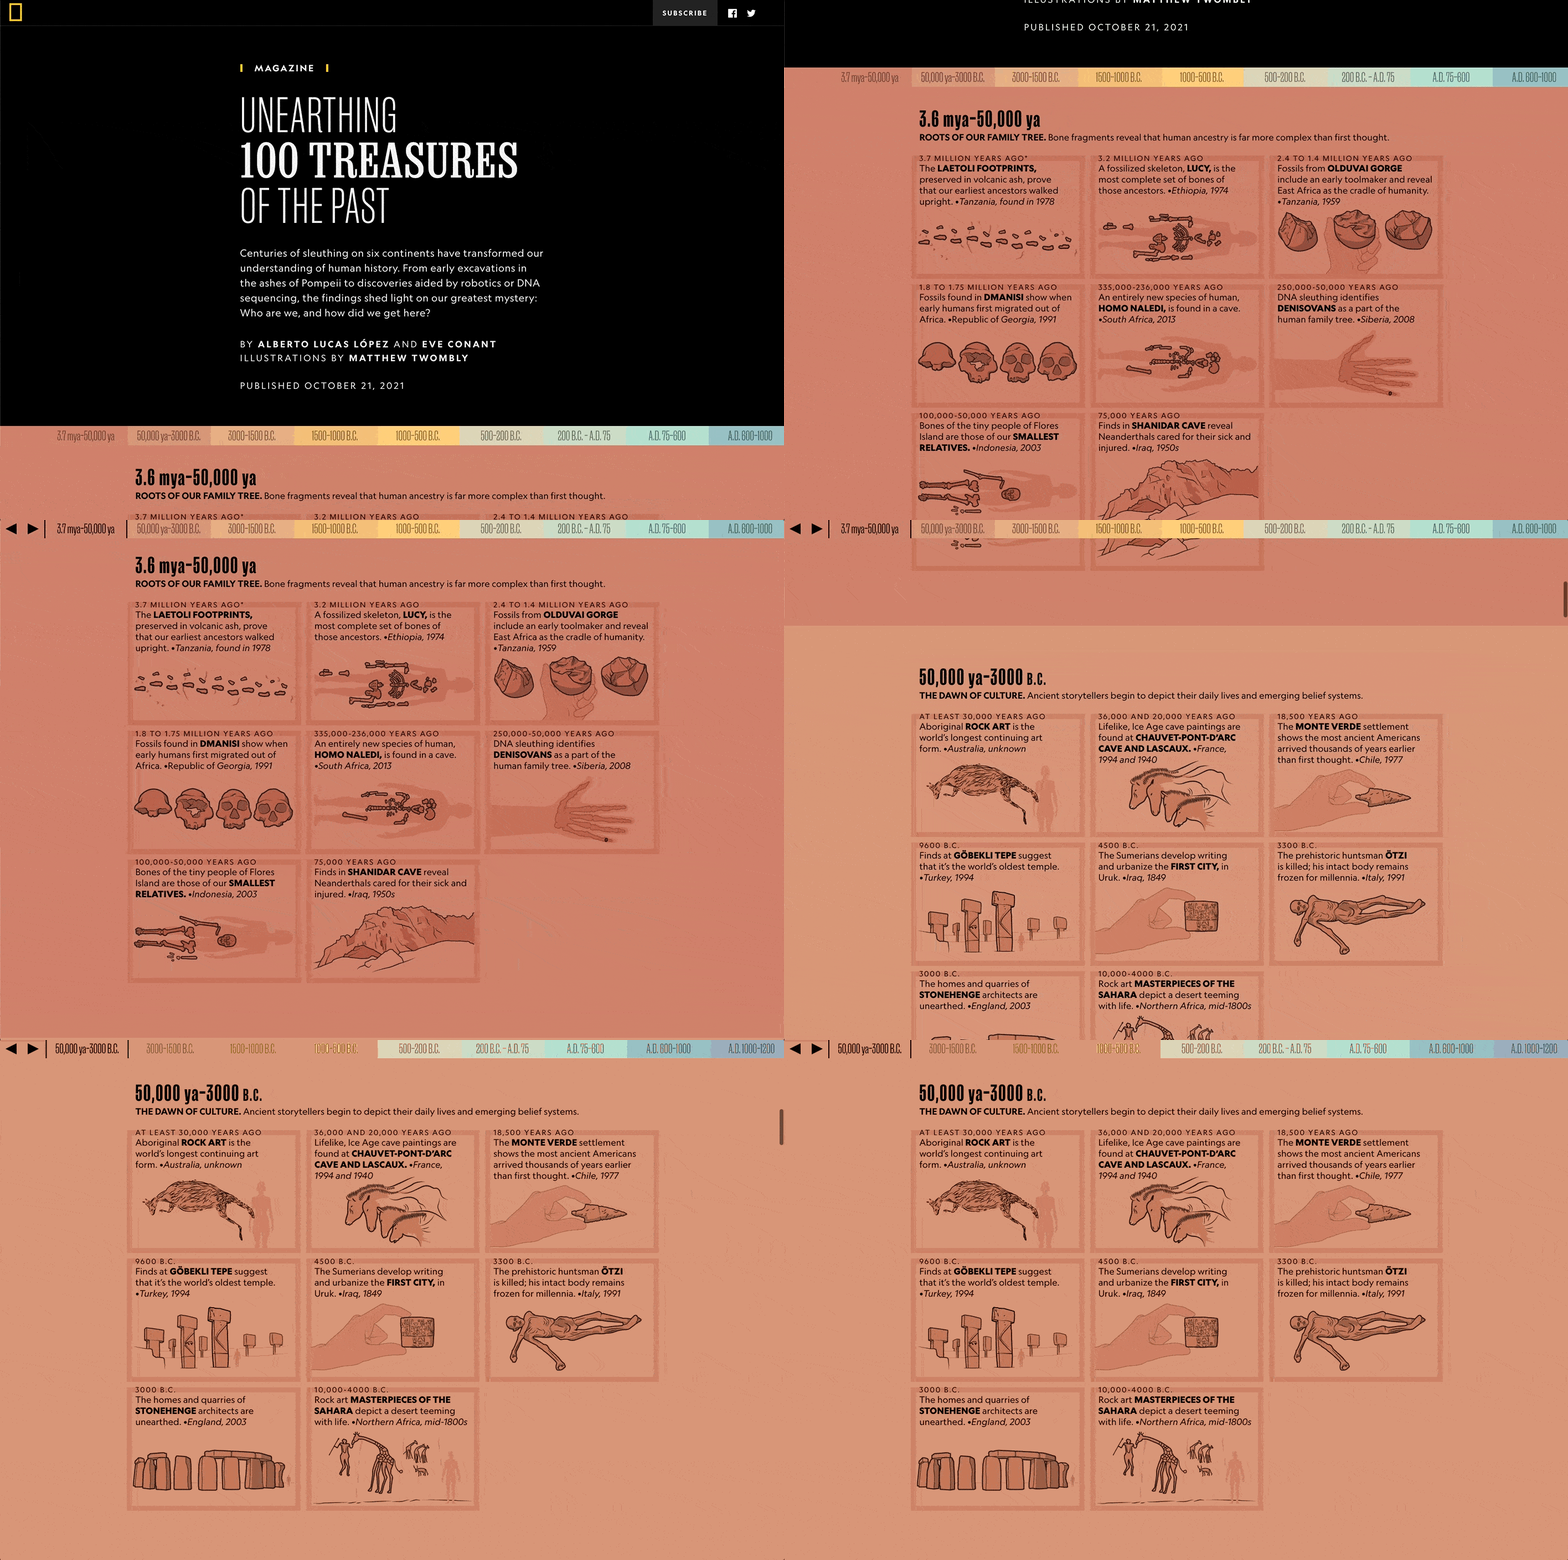
View more example stories at National Geographic here: https://www.nationalgeographic.com/
Google Arts & Culture
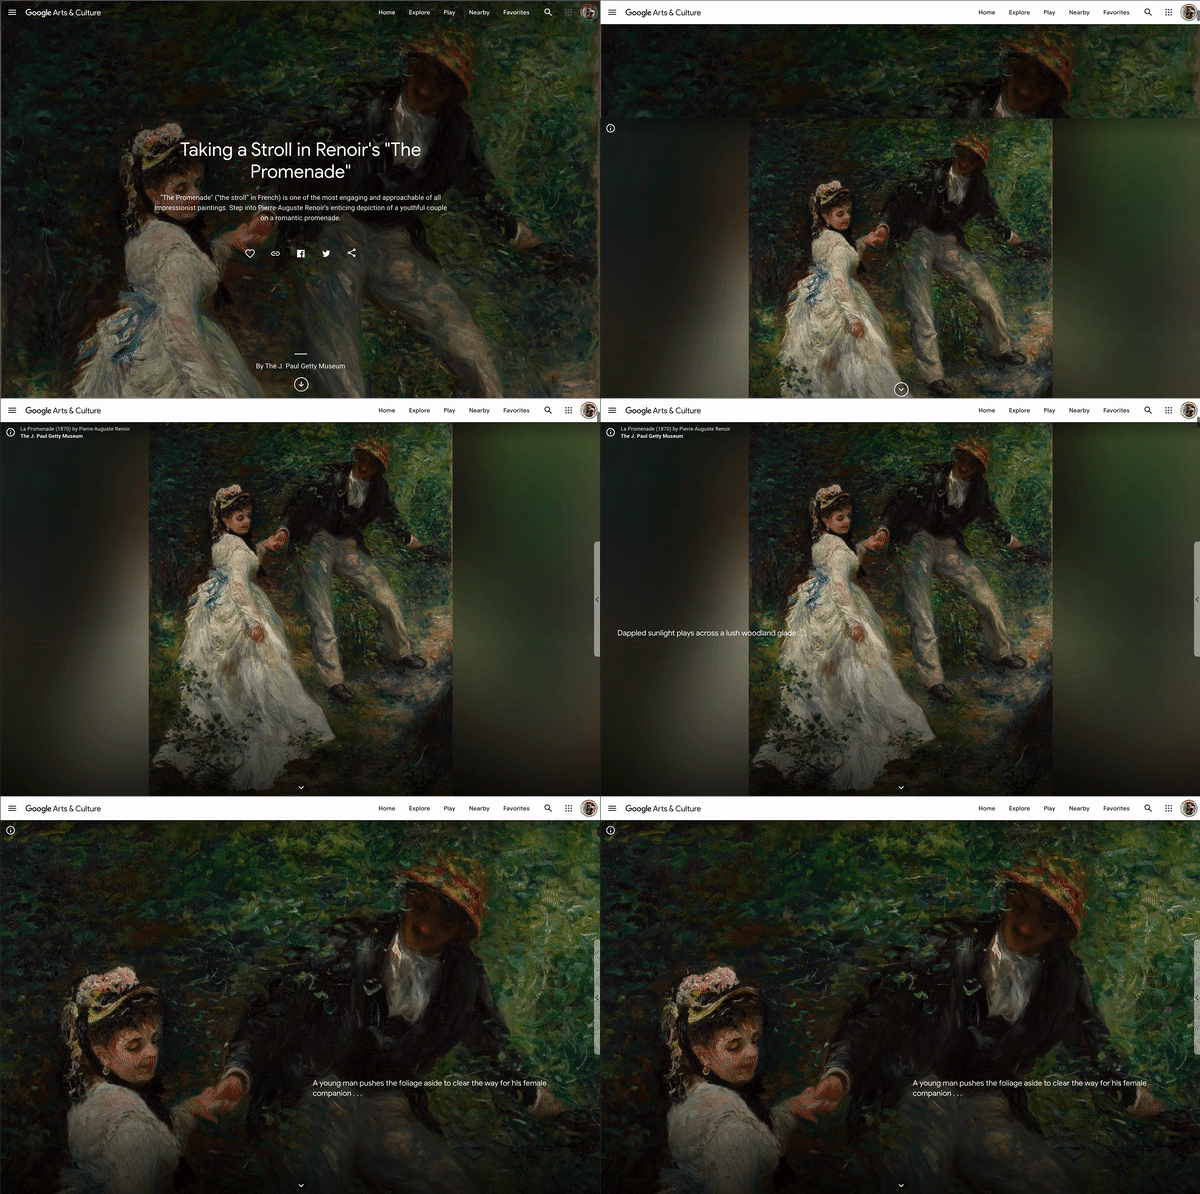
Google Arts and Culture has developed one of the most sophisticated visual storytelling platforms for cultural heritage. The stories on GA&C offer scrolling vertically or horiztonally through images as if in a large slide show, and their editing interface for creating them will look familiar to professors and students the create slideshow presentations. In addition to the slides, stories also feature zooming around to different points on an image to showcase specific closeups.
The stories on GA&C exhibitions are an critical part of bringing users into each exhibition on their platform: without them, users may be lost just exploring lists of items without understanding the overall narrative that the exhibition creates.
Example Visual Stories on Google Arts & Culture:
- Sights and Sounds of George Seruat: https://artsandculture.google.com/story/2wVRhJynjA2P0g
- 7 Extreme Locations around the World: https://artsandculture.google.com/story/8QVRZJwJ_NQYSQ
- Art from France: from Delacroix to Cézanne: https://artsandculture.google.com/exhibit/art-from-france-from-delacroix-to-cézanne/FgJiBunAHz0aLg
Scalar
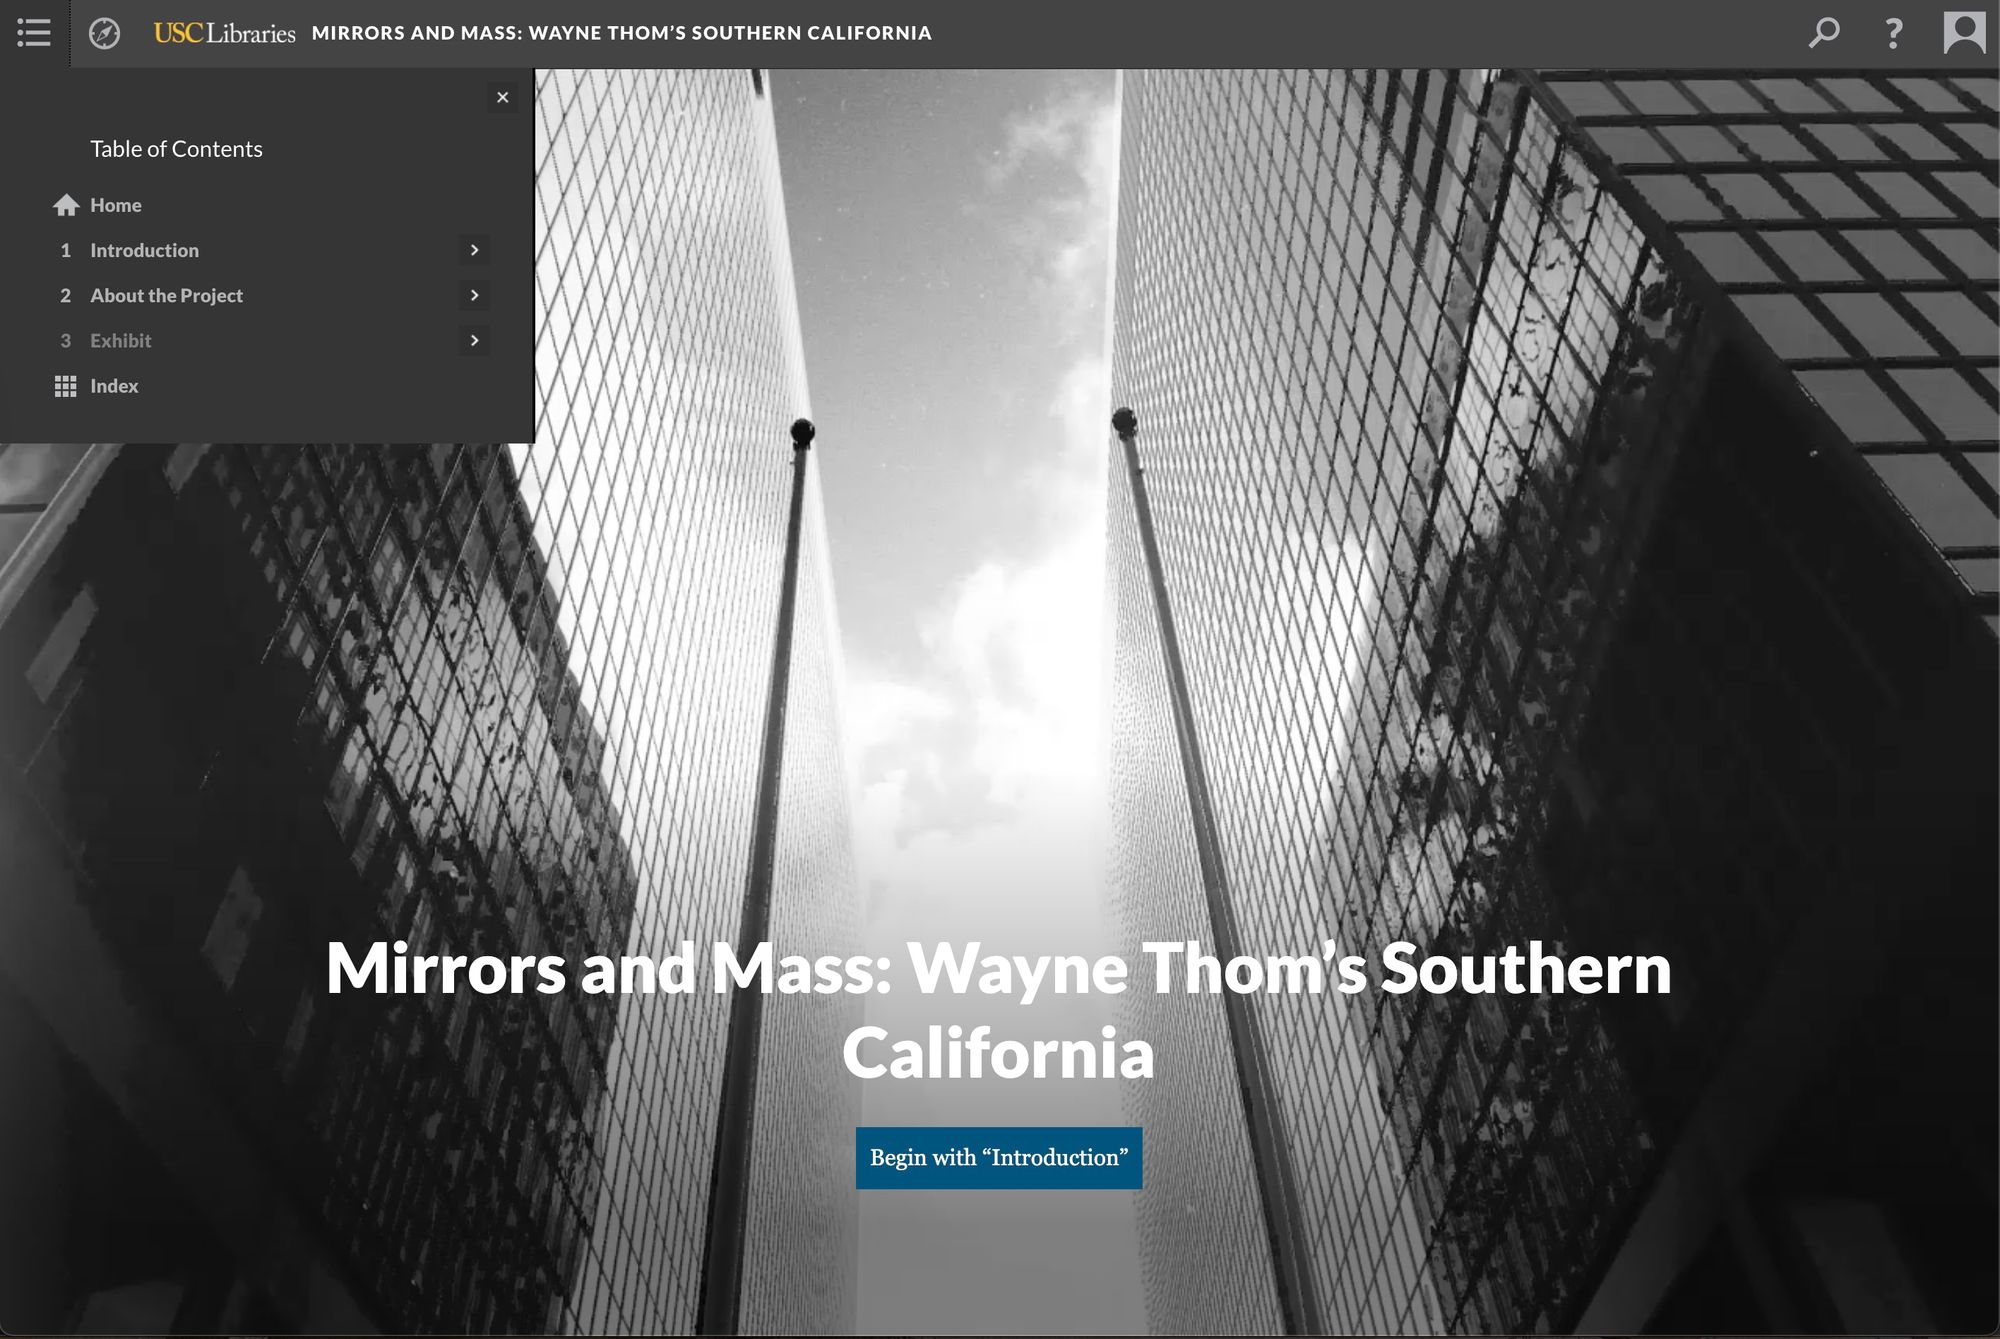
Scalar is an open-source academic technology developed by the Alliance for Networking Visual Culture. It offers many features for publishing monographs, exhibitions, and monographs, and it’s open source so in-house university developers may extend its functionality for your project. It offers data visualizations and direct integrations with Omeka as well, so you may port all your Omeka artifacts into a Scalar story and reference them in your text.
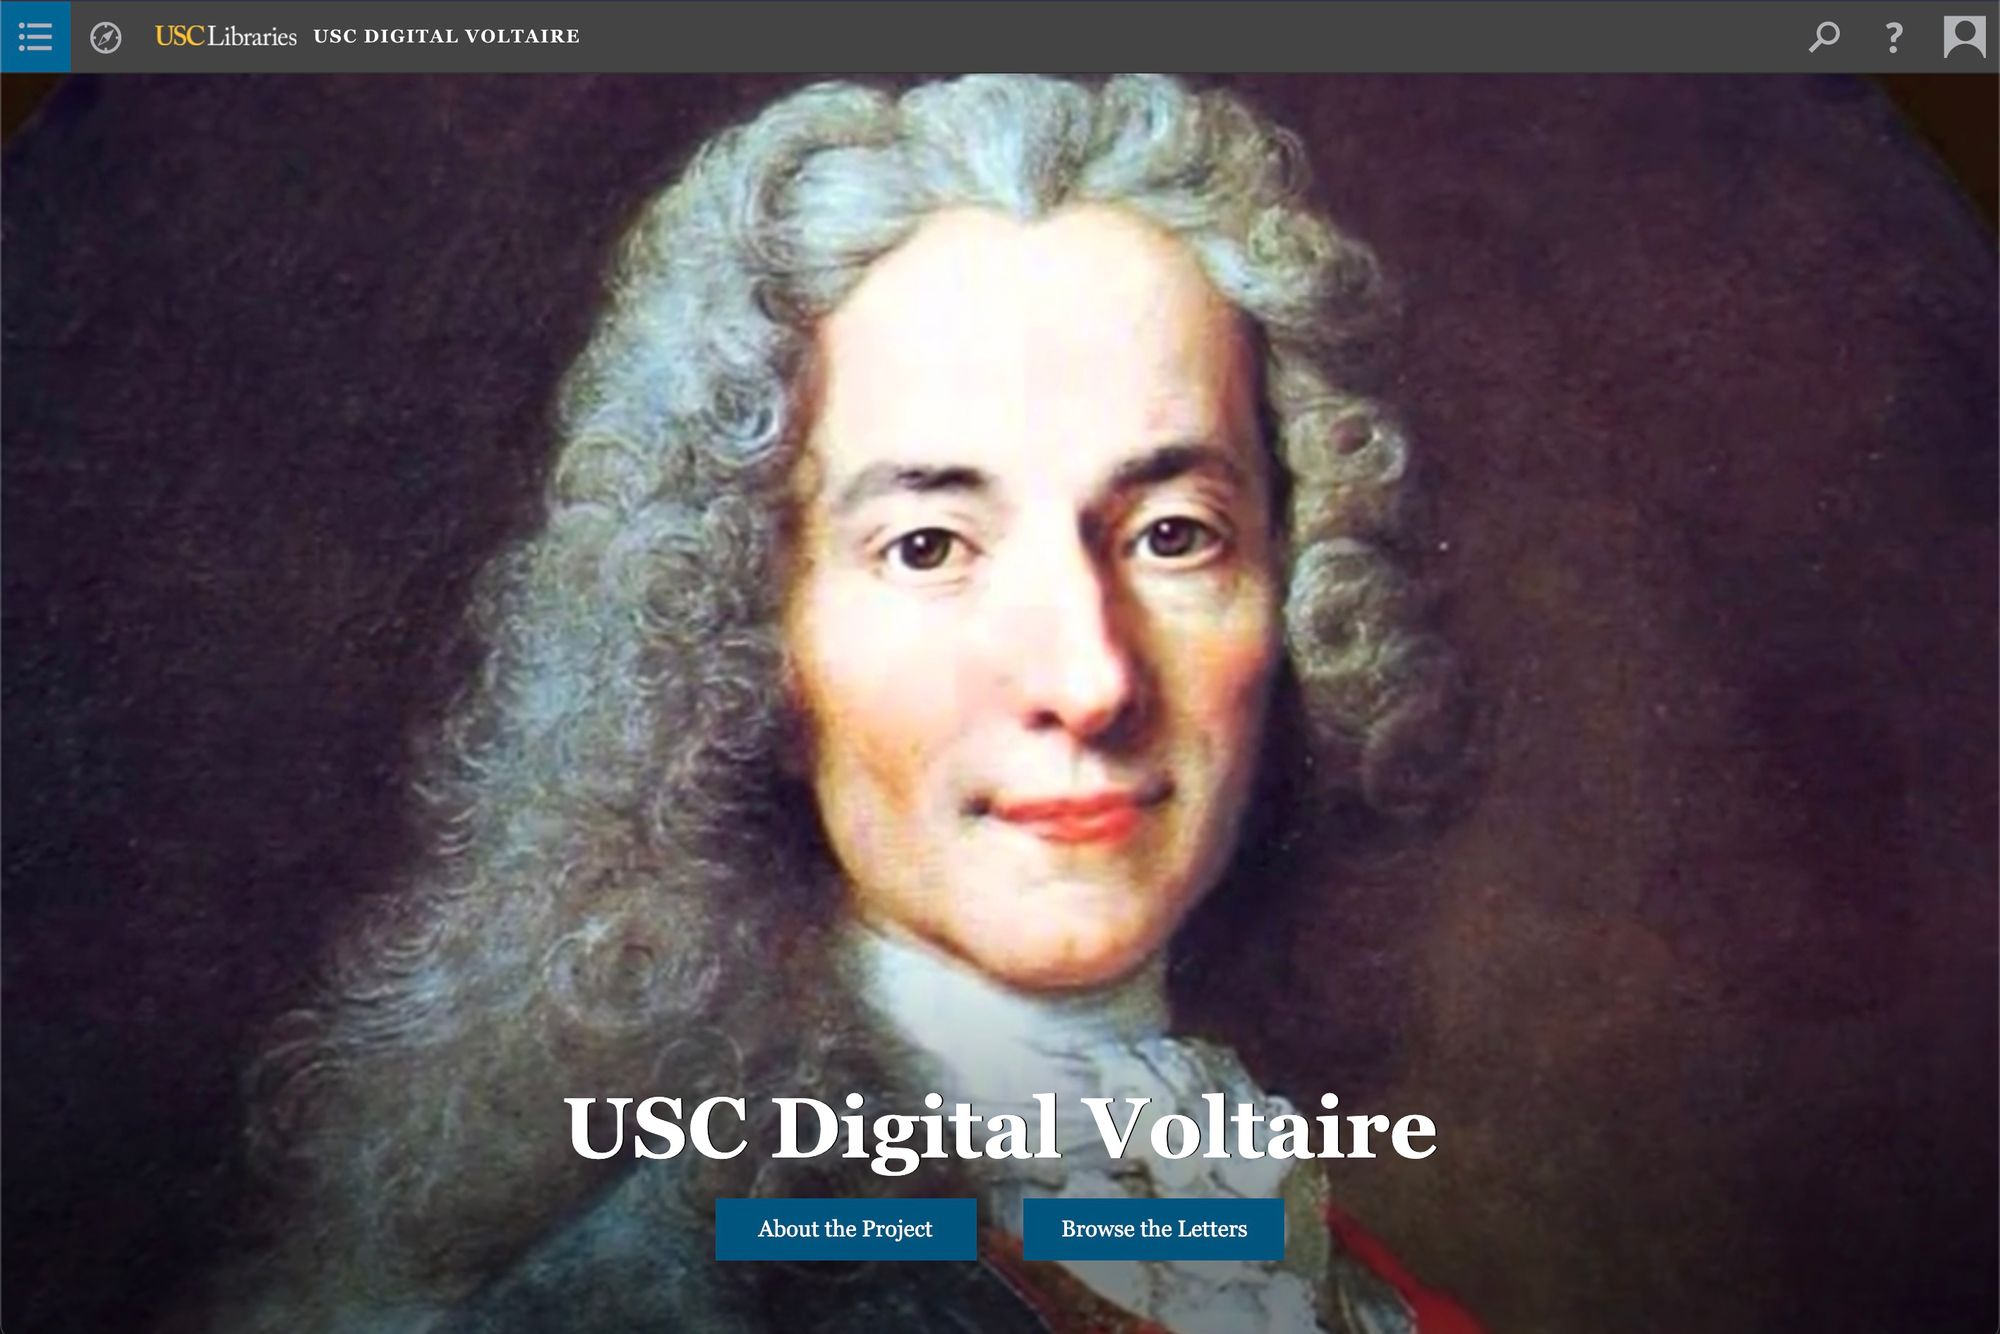
Scalar may also be used to publish critical editions, such as the Digital Voltaire project.
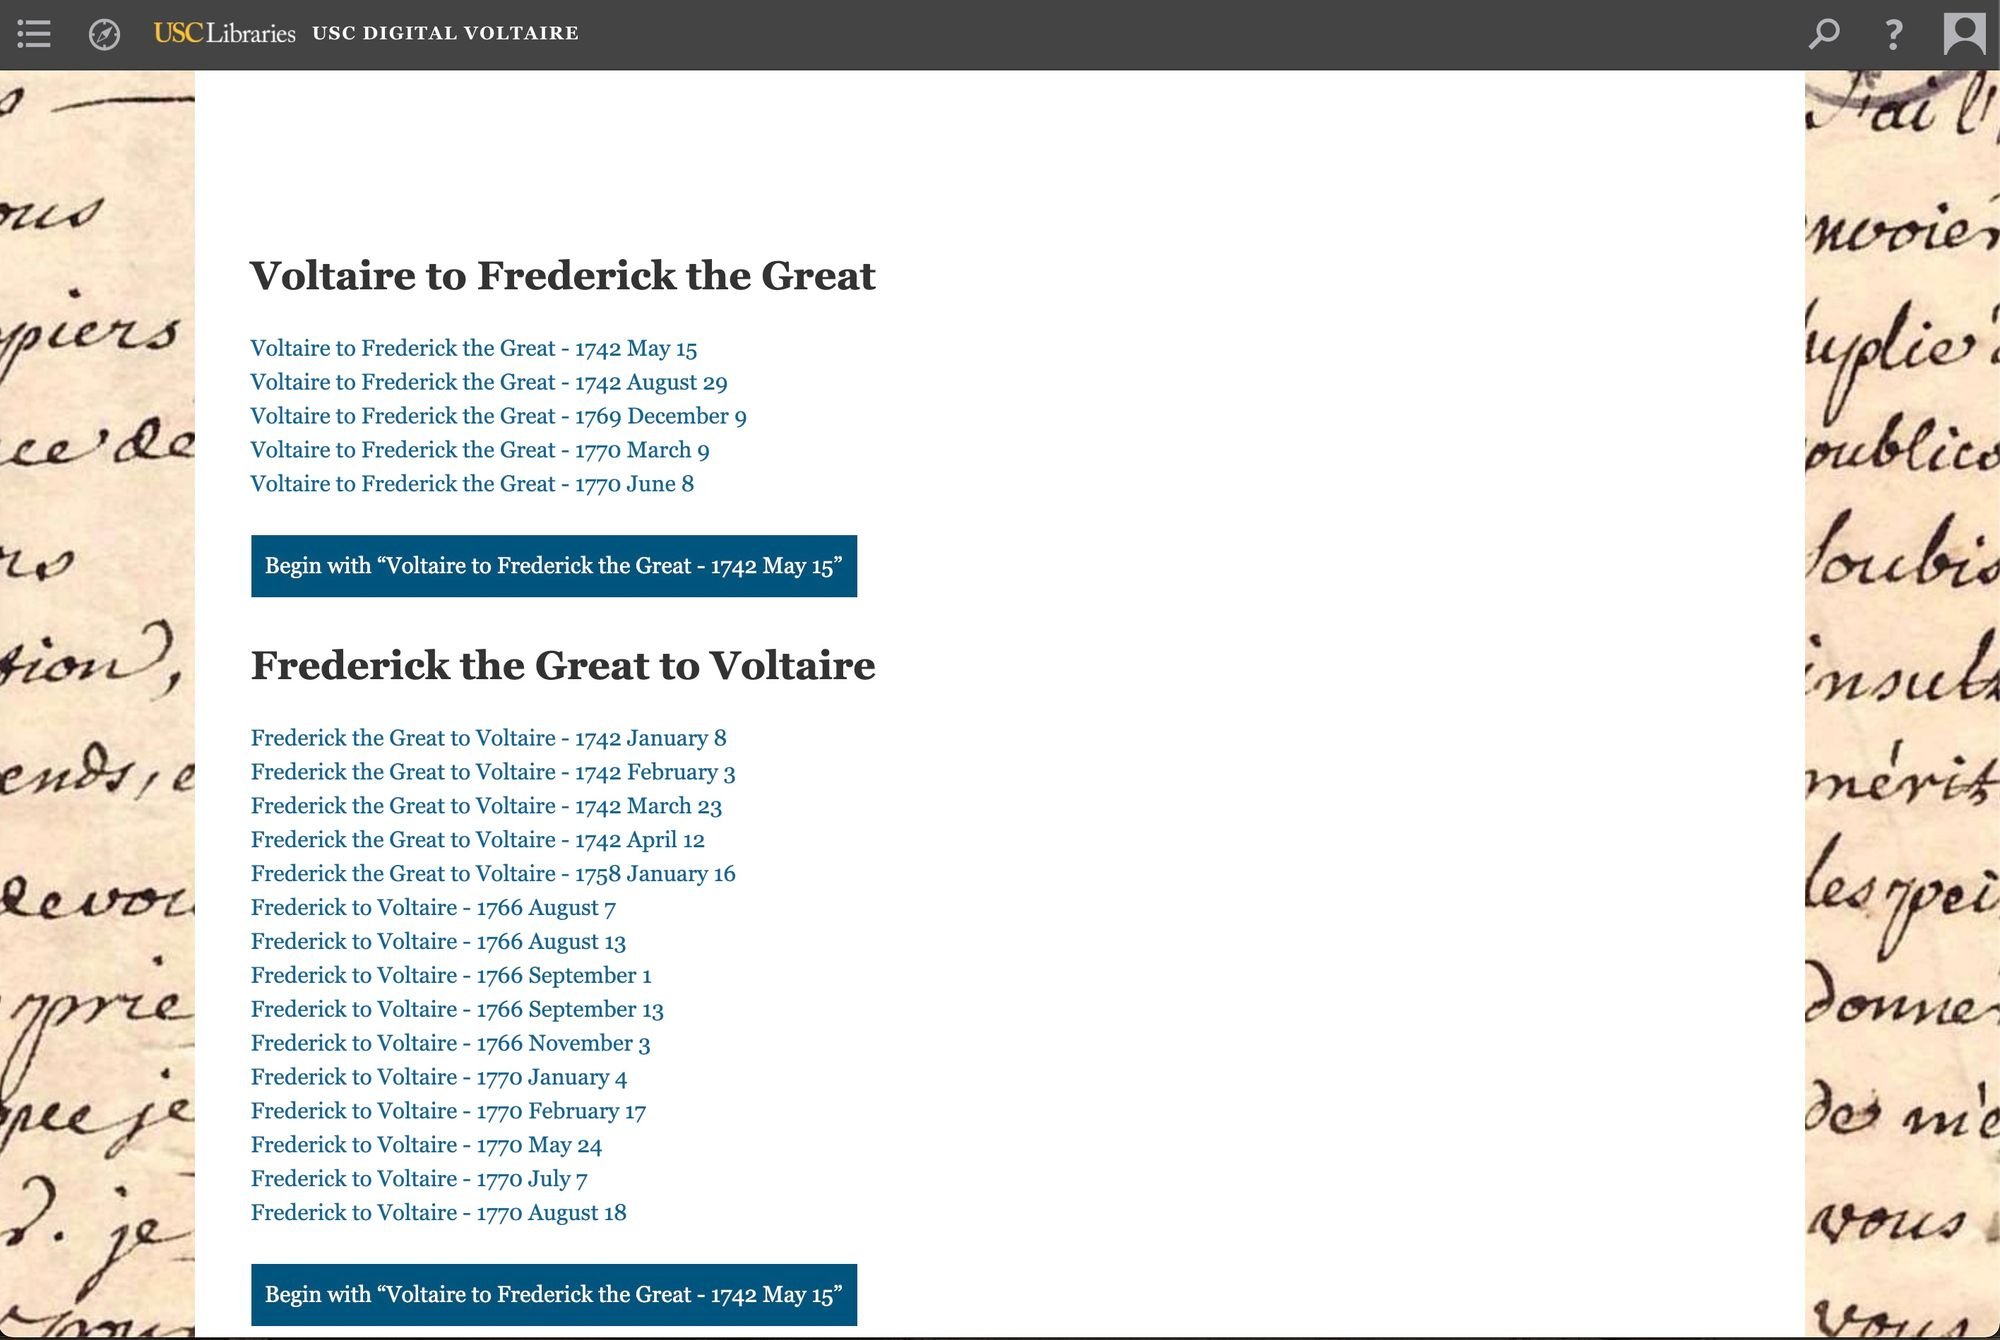
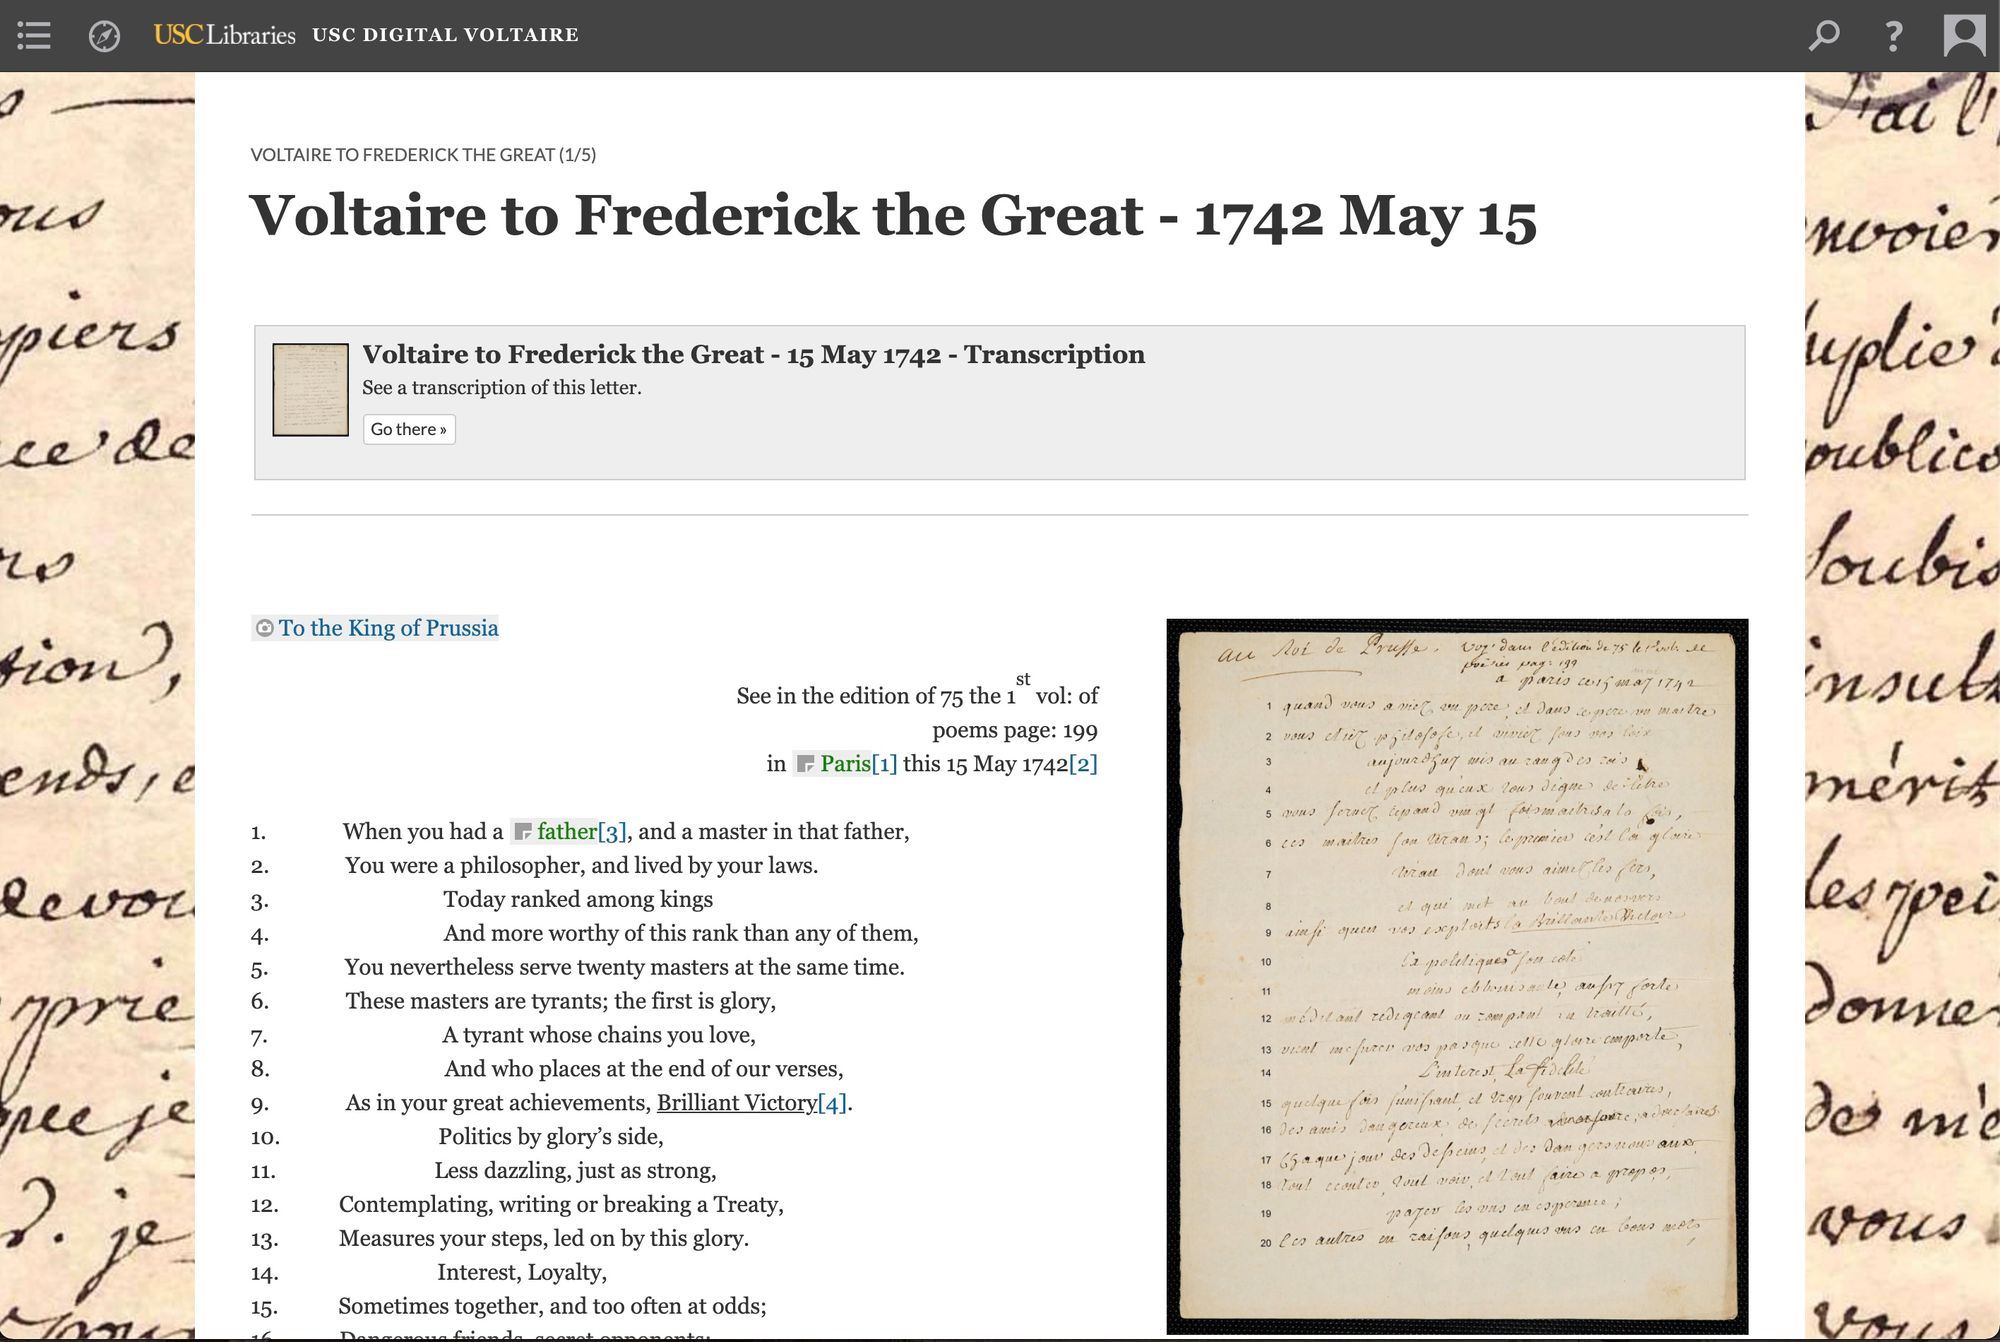
Scalar is developed by institutions for institutional/scholars’ research needs. See more examples in their showcase at https://scalar.me/anvc/scalar/showcase/
Mused
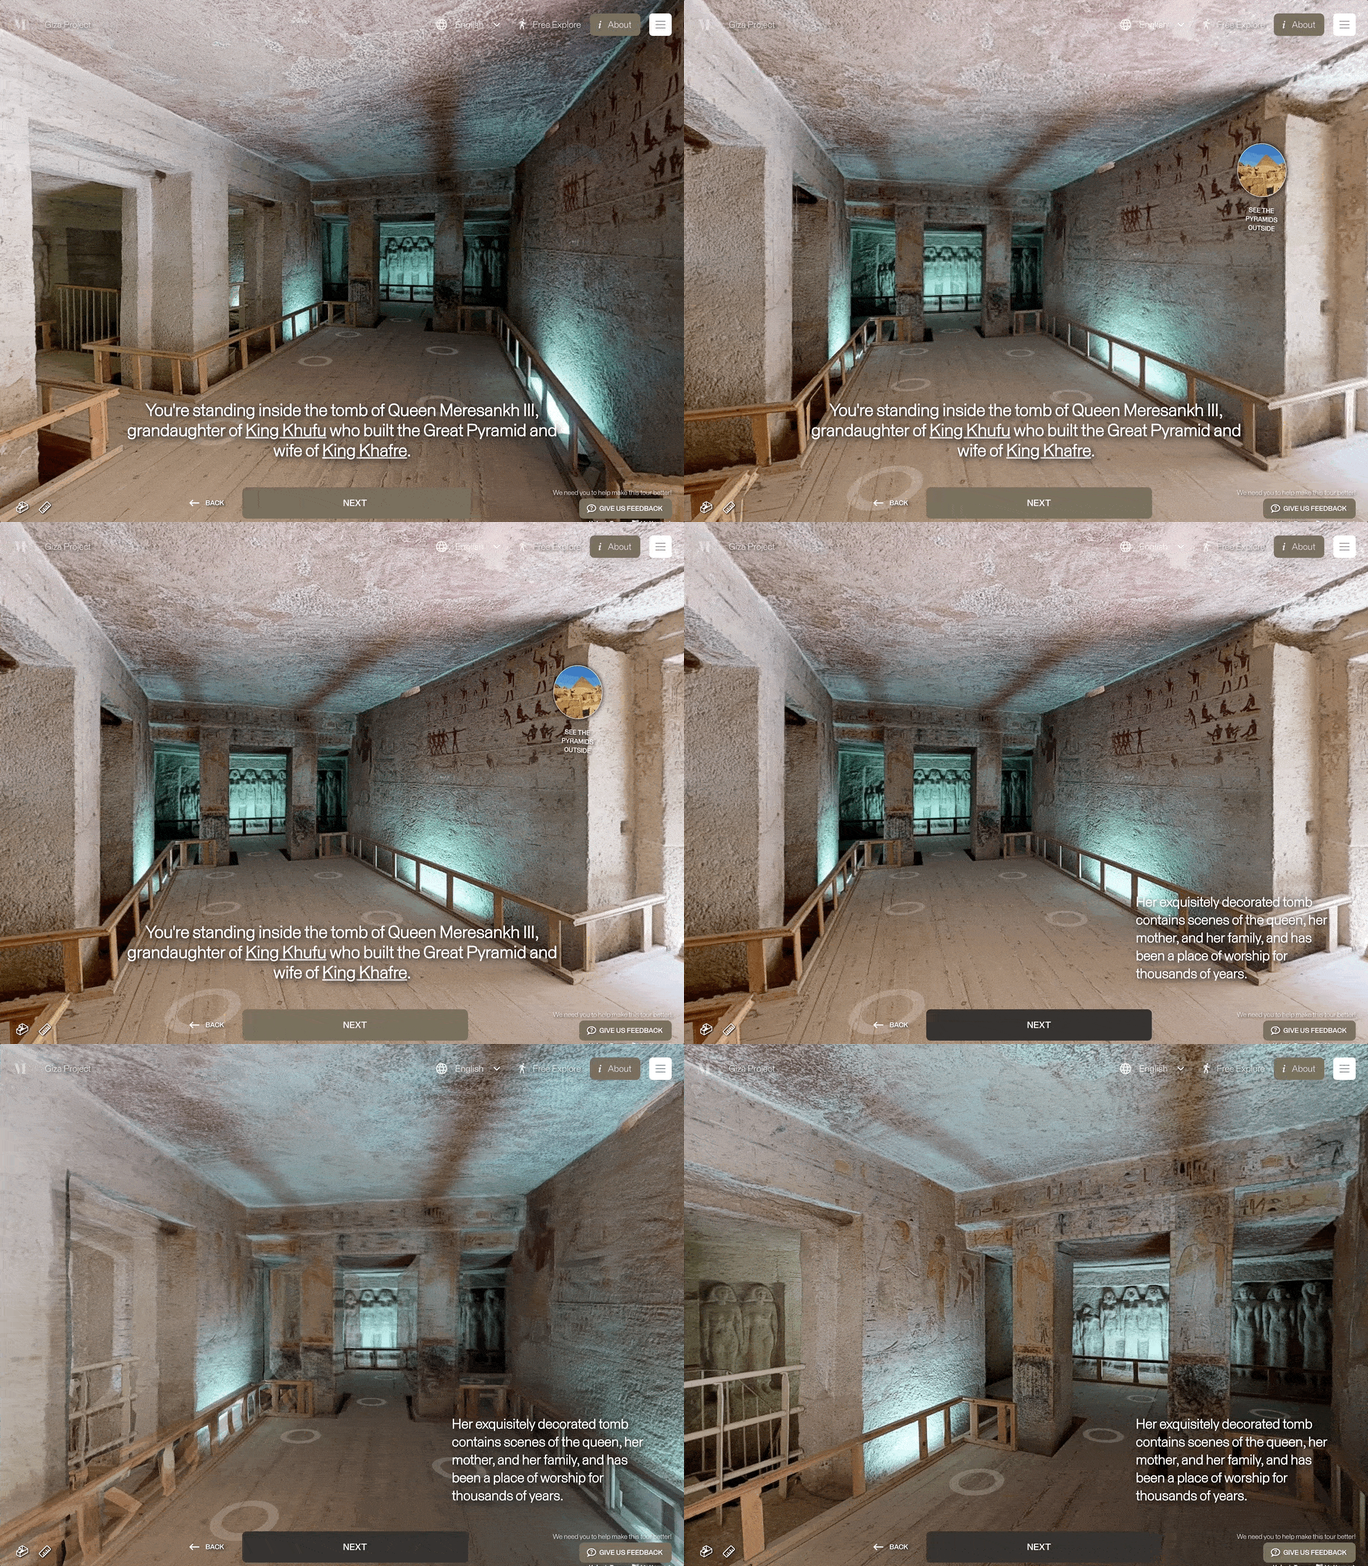
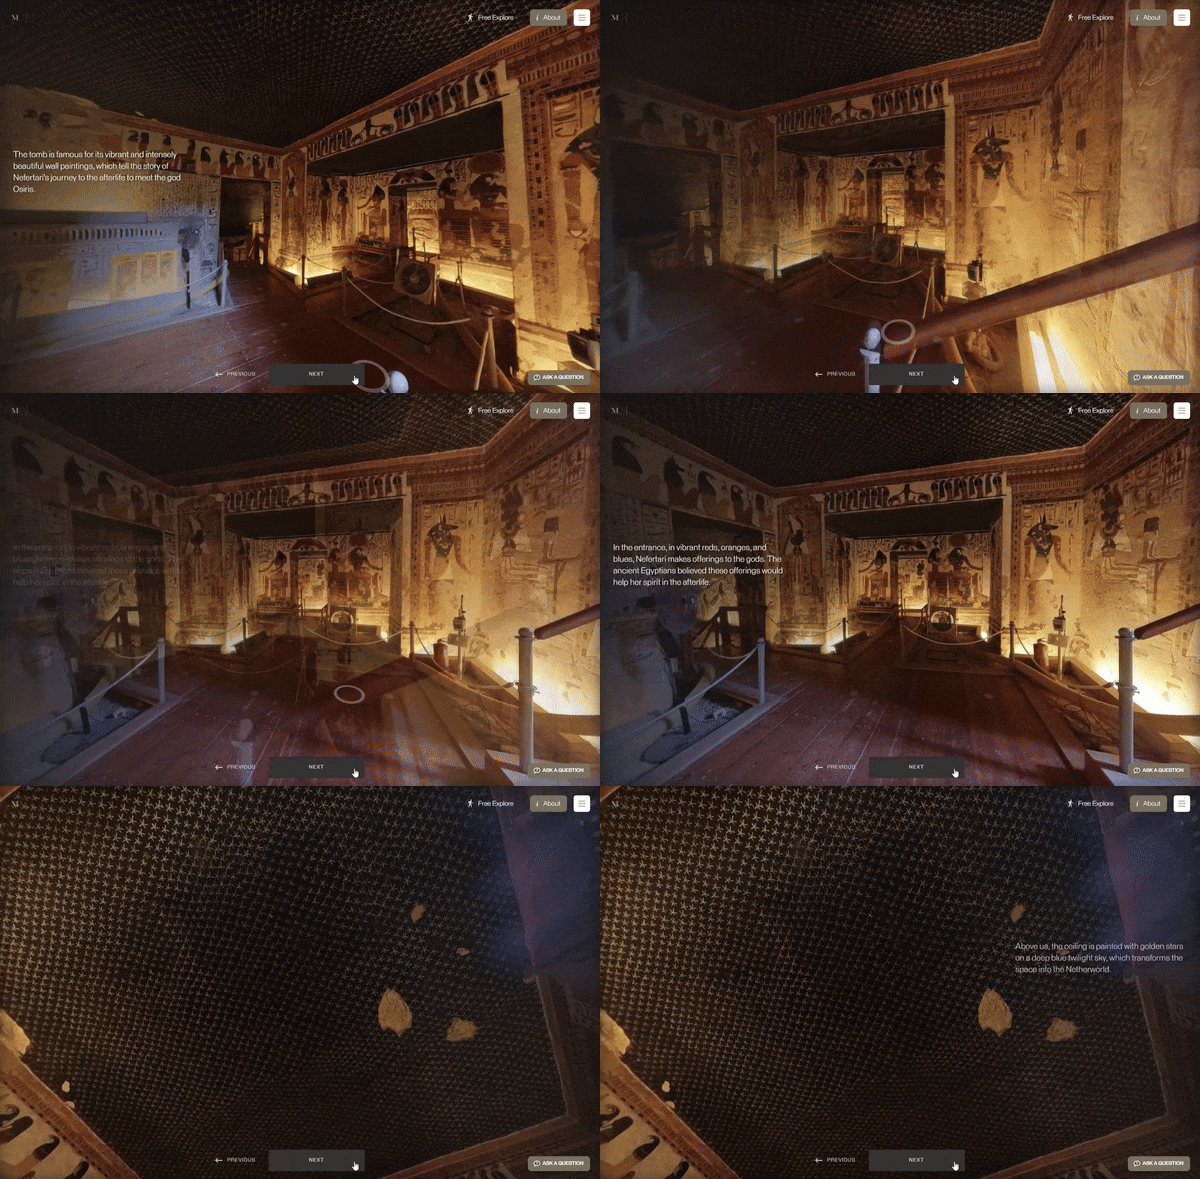
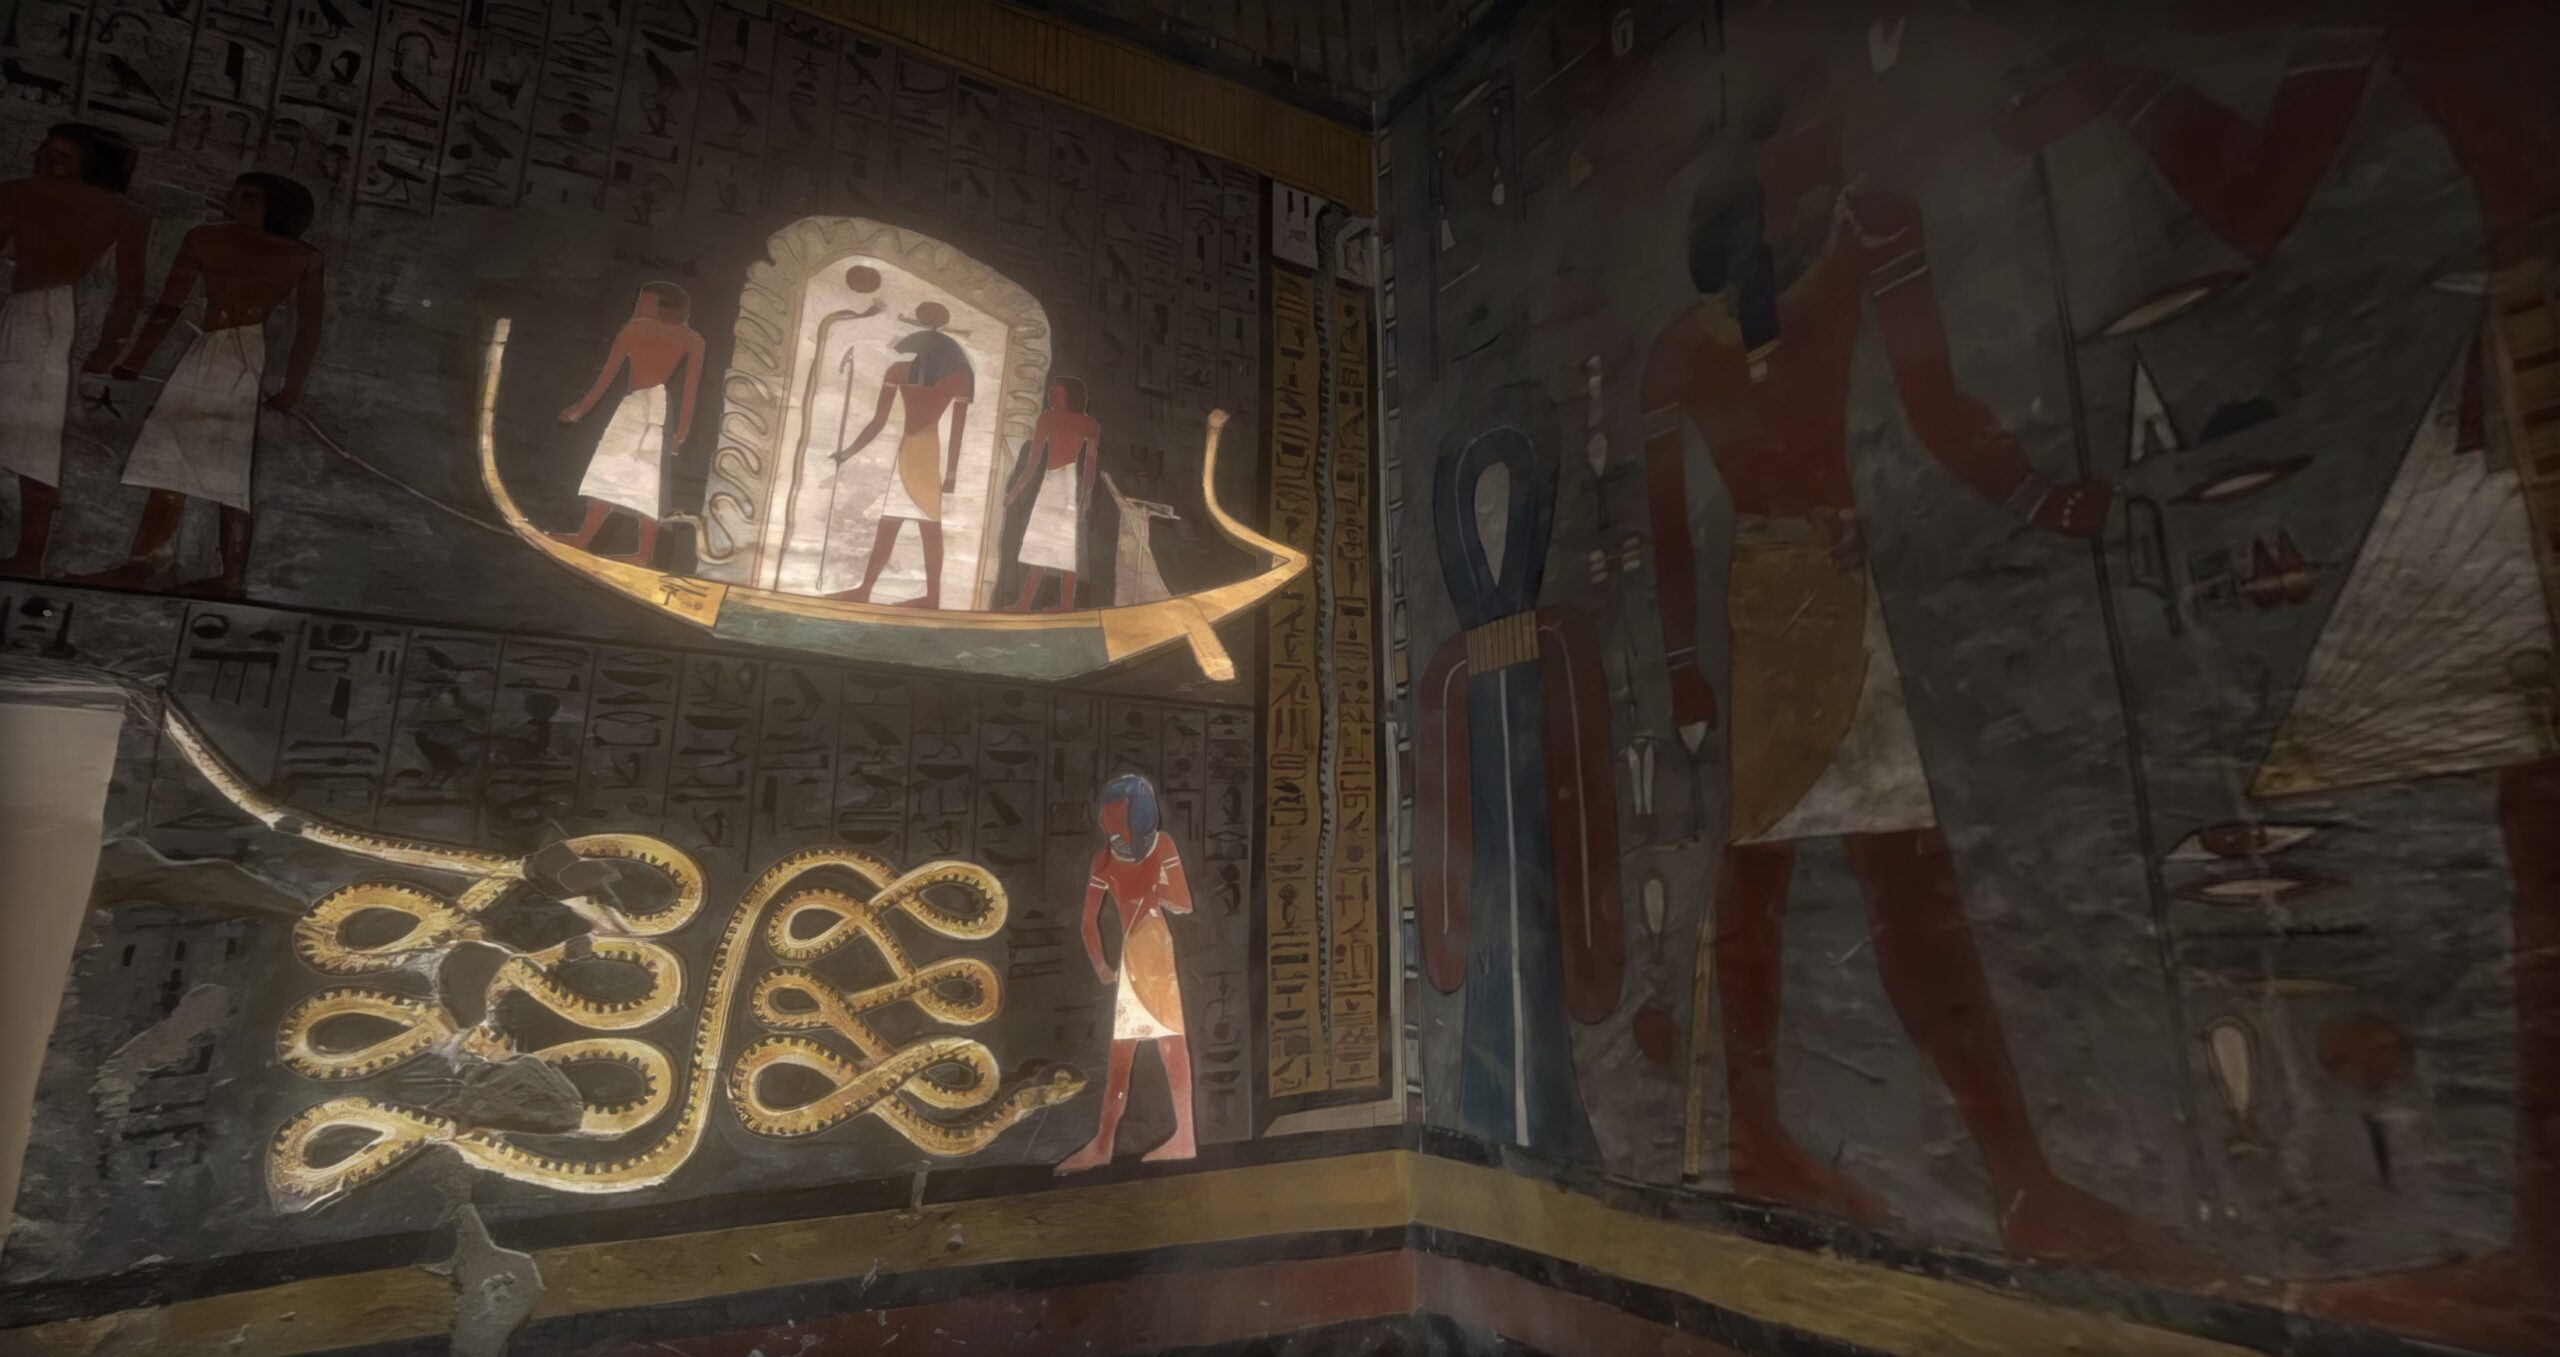
The Mused interactive storytelling features 3d integrations for both guided tours in 3d tours and long-form narratives that link to collections and 3d models. These enable you to publish visual narratives incorporated in your exhibition, with an emphasis on interweaving virtual tours and 3d content with your stories and vice versa.
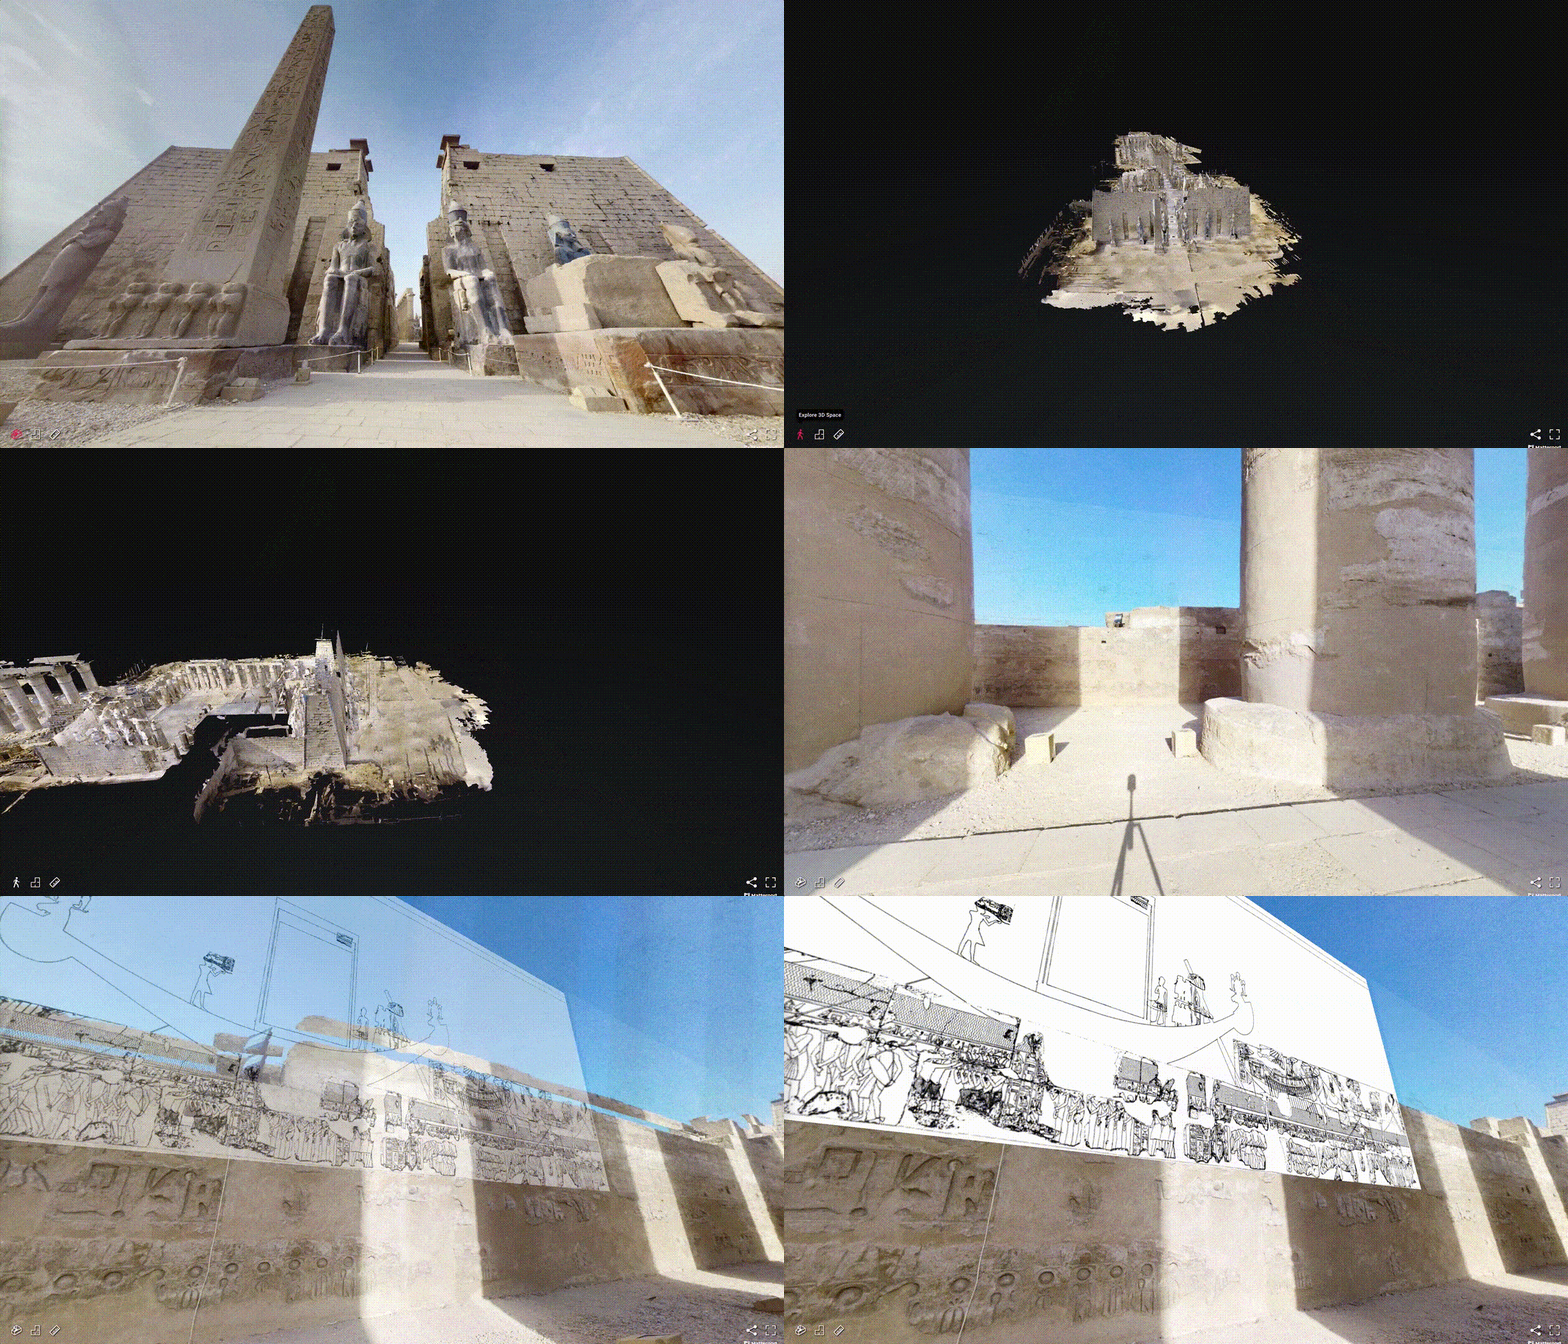
Here are some example Guided Tours that tell a story directly in the 3d Environment:
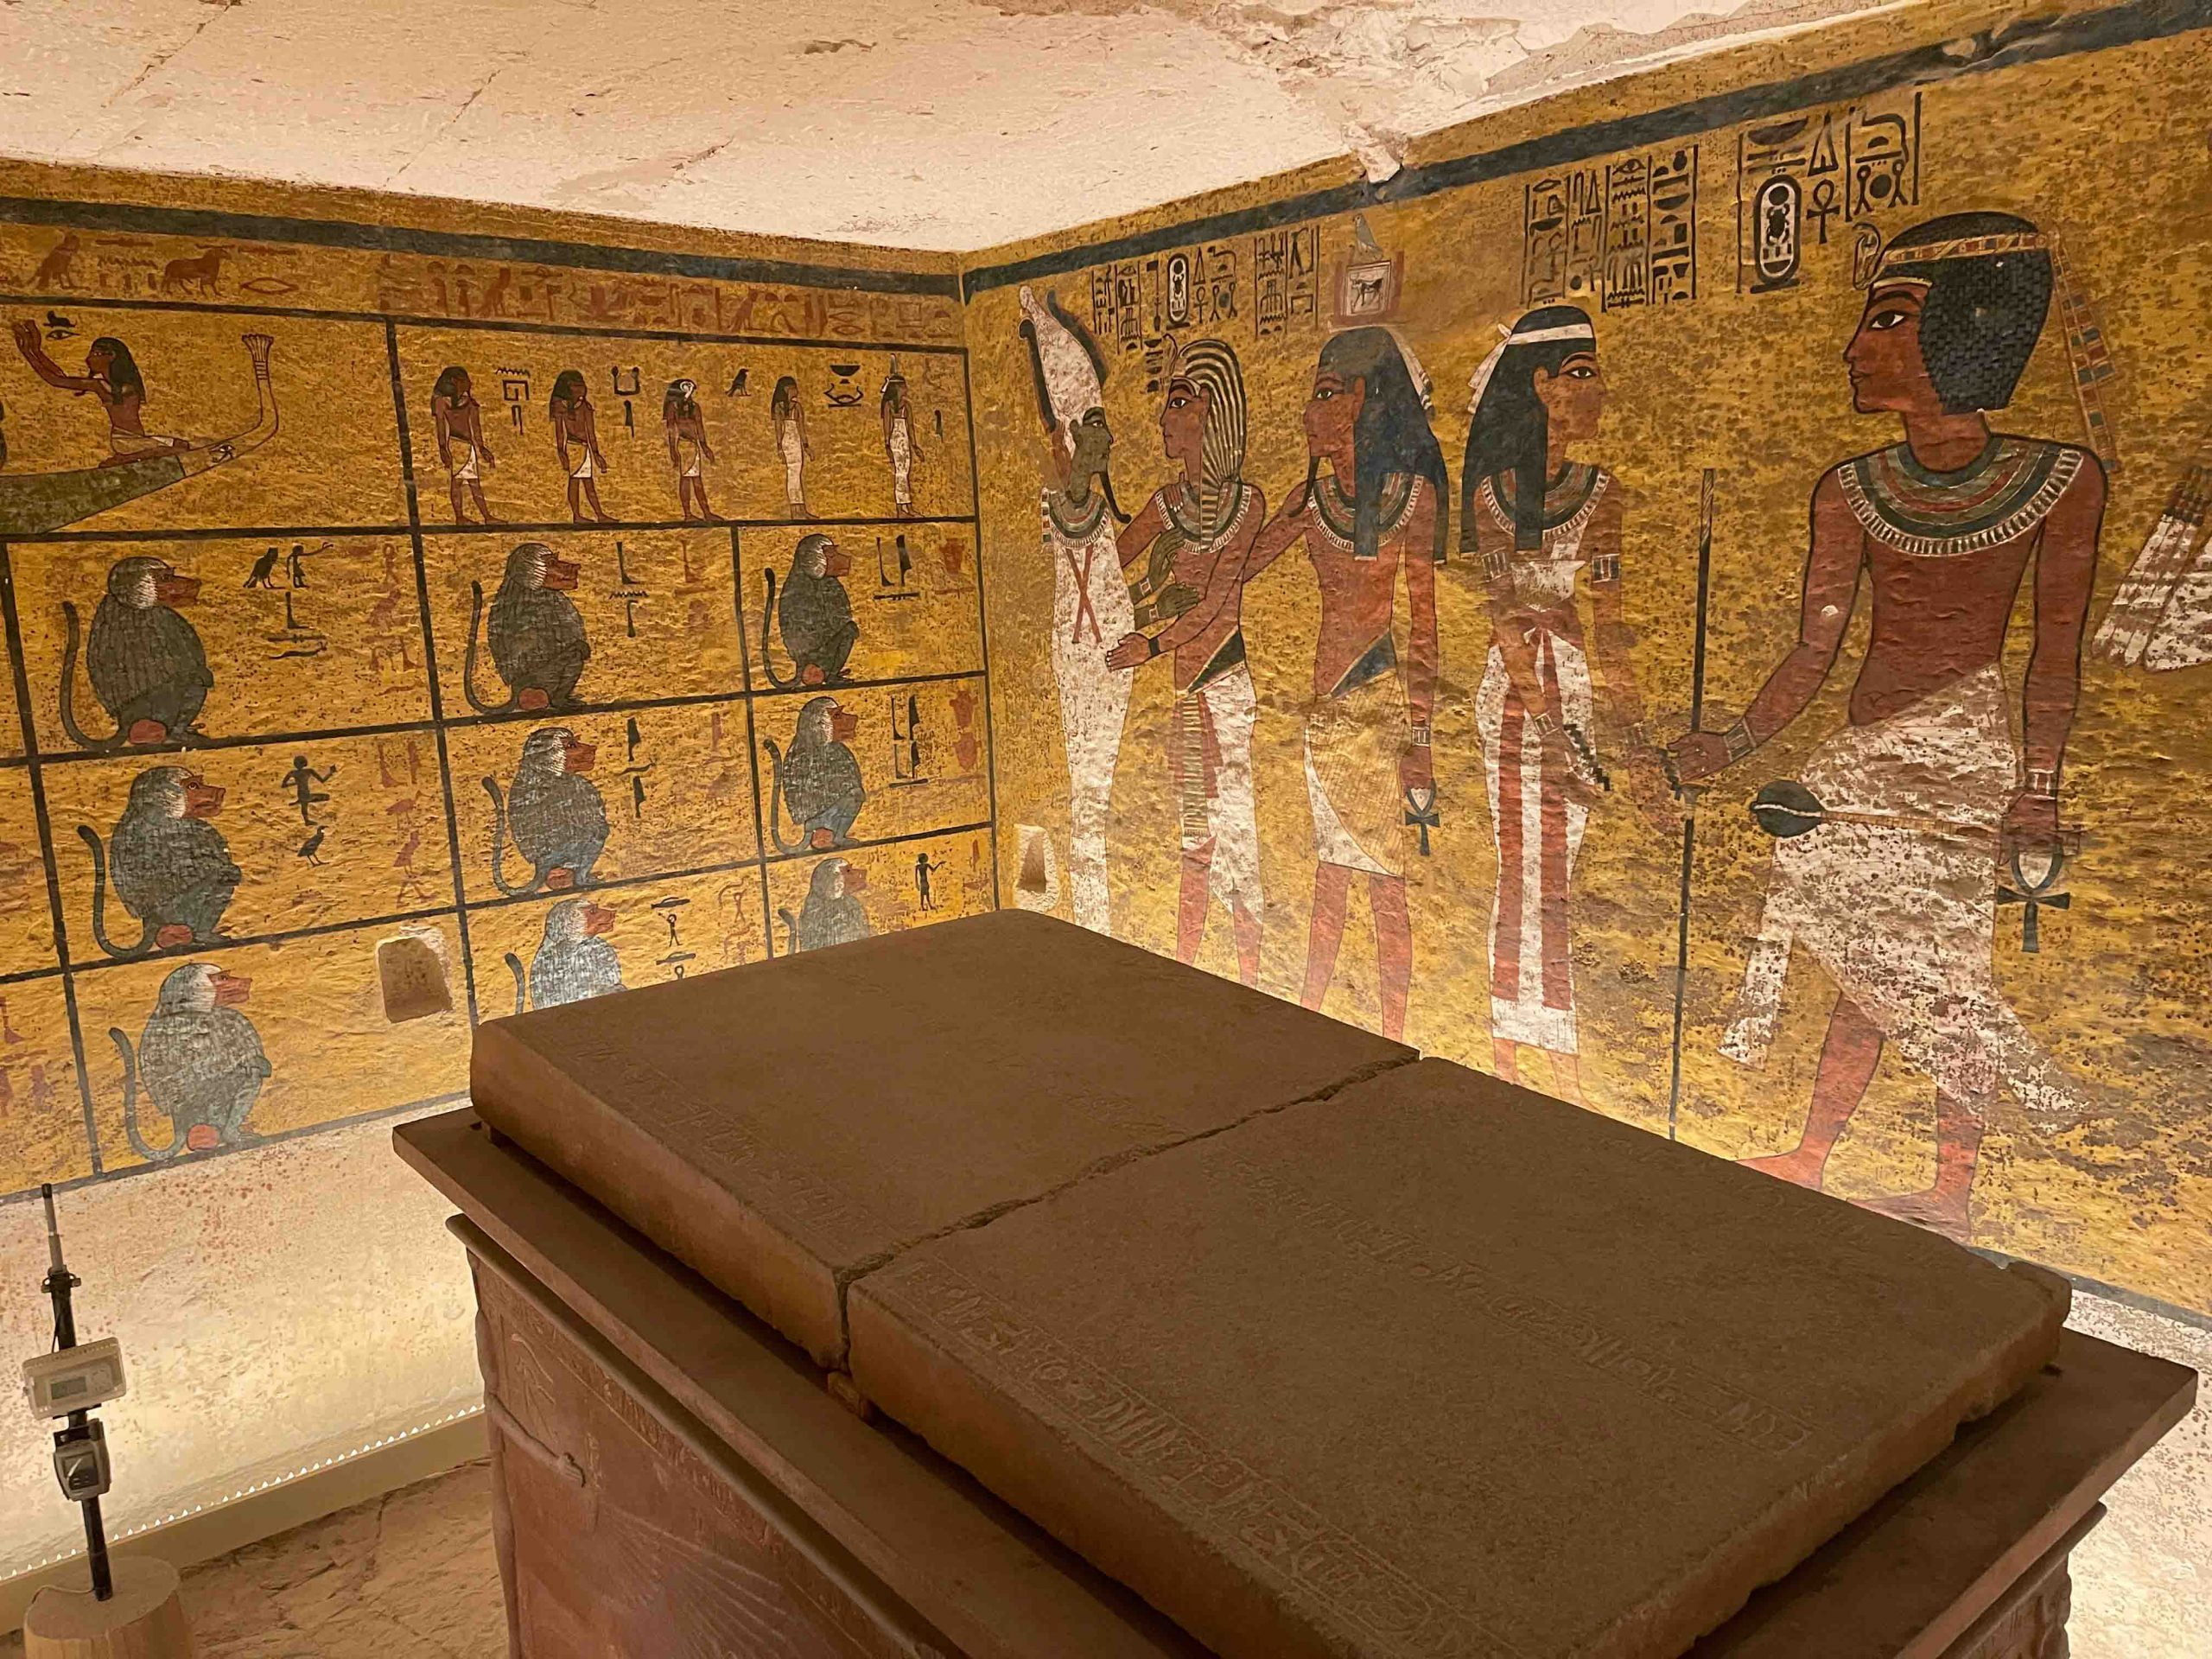
Guided Tour of the Tomb of Queen Meresankh III, Giza Project, Harvard University: https://giza.mused.org/en/guided/4/tomb-of-queen-meresankh-iii-g-7530-7540
Virtual Field Trip to Luxor Temple: https://luxortemple.mused.org/en/guided/178/luxor-temple
Mused also supports the creation of in-depth narrative text-forms stories where you can design your story in narrative sections that can feature narrative text and individual items, virtual tours, a list of items, or a multiple choice question. These allow users to explore your archive with interpretative materials that showcase the narrative of your collection.
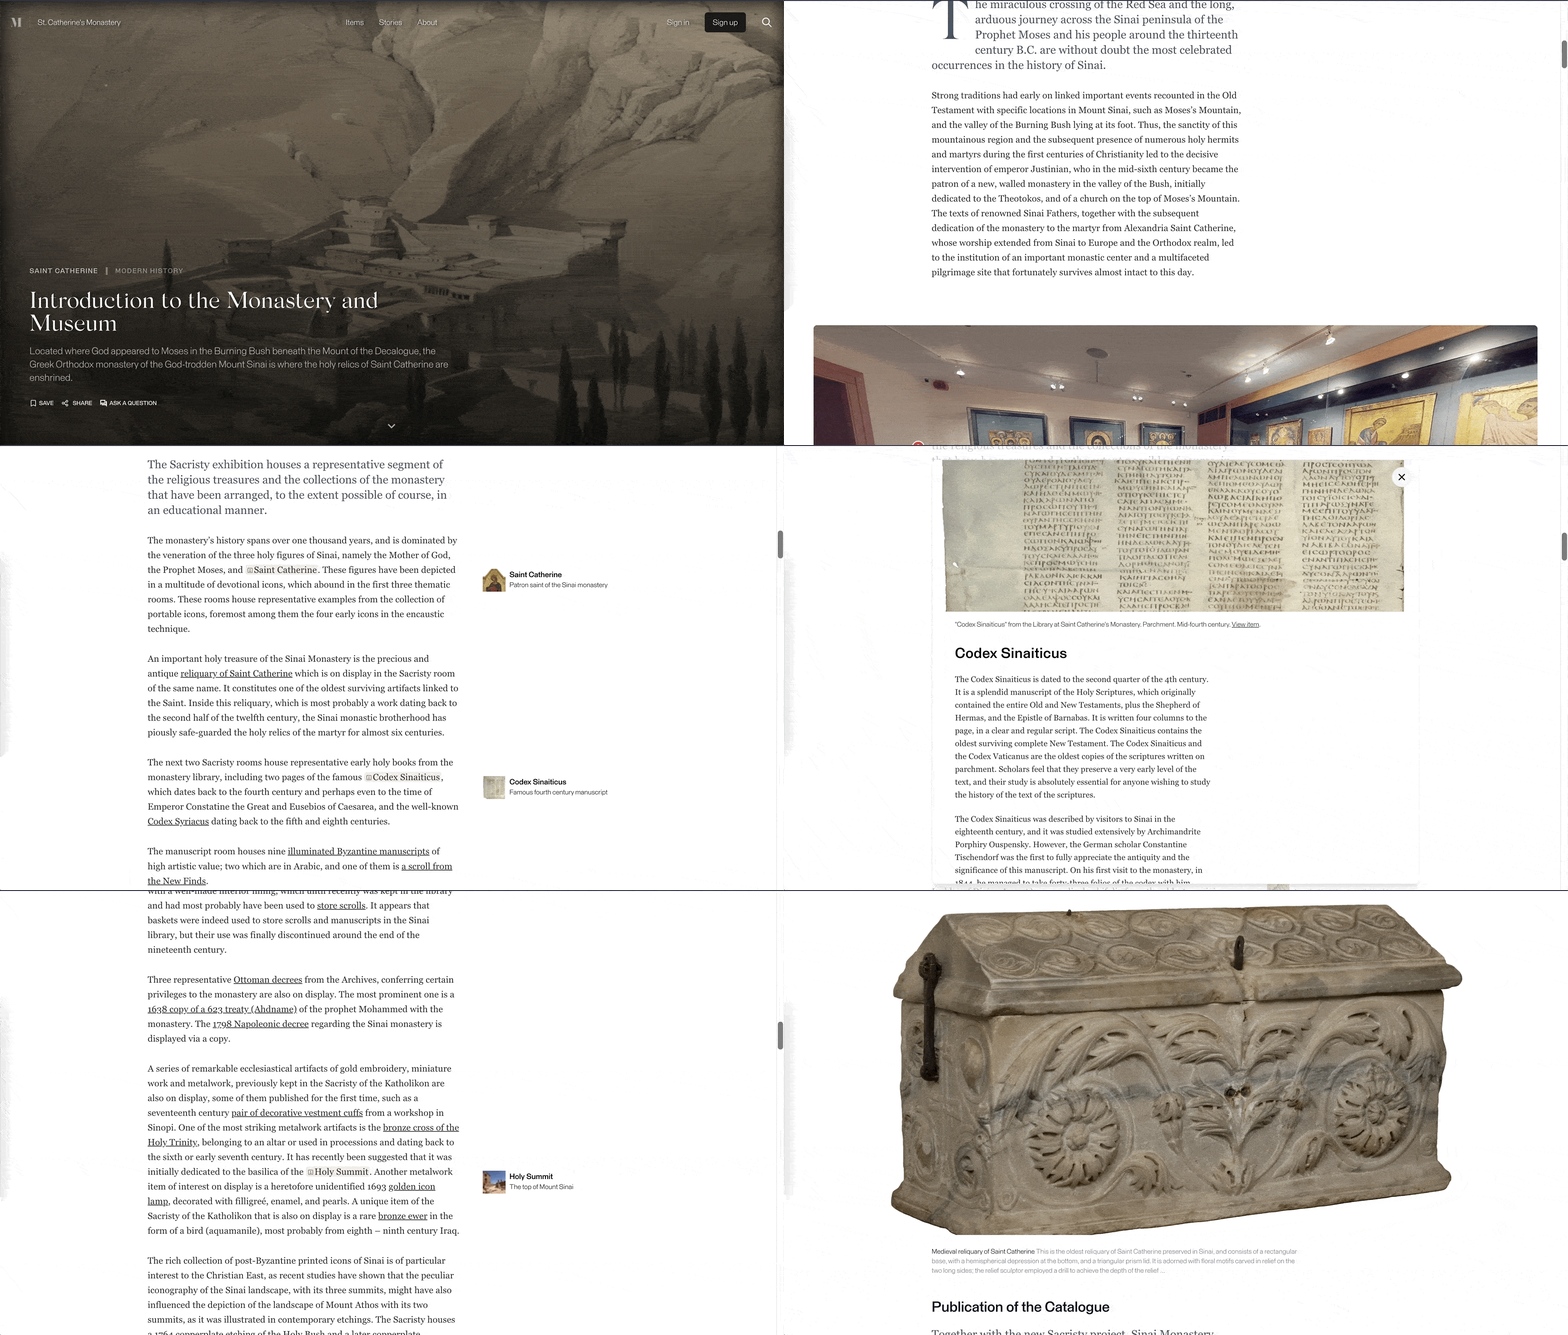
You can click and view the annotations without leaving the story. Clicking on any of the items included in your story takes a visitor to the item record in your exhibition collections database.
In addition to these features, you can also explore a virtual tour directly next to your narrative text to make the experience of moving between long-form narrative and virtual tour more seamless.
Check out more of how heritage workers are publishing stories on Mused here:
- Introduction to Saint Catherine’s Monastery: https://stcatherines.mused.org/en/stories/31/introduction-to-the-monastery-and-museum
- Ancient Egyptian Religion at Luxor Temple: https://luxortemple.mused.org/en/stories/126/ancient-egyptian-religion-at-luxor-temple
- The Great Hunt Mosaic at the Villa Romana del Casale: https://villaromana.mused.org/stories/2/the-great-hunt-mosaic
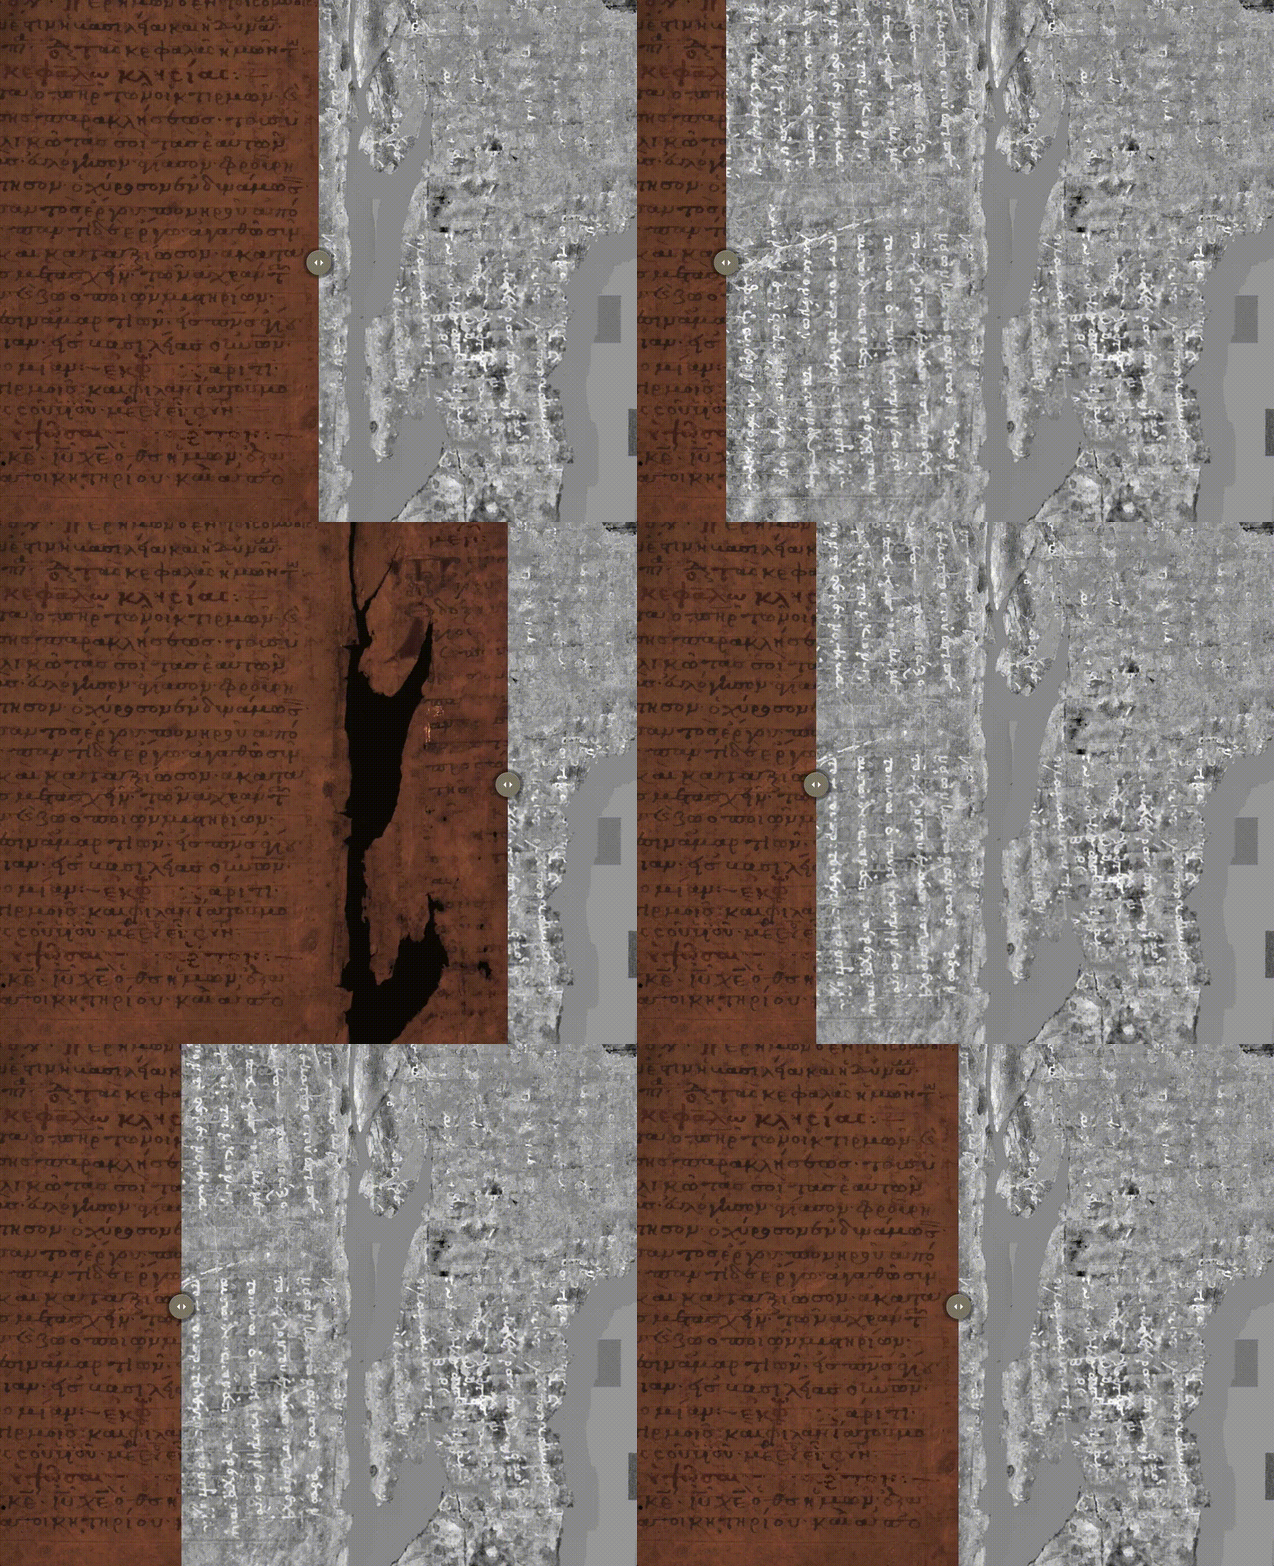
- Manuscripts at St. Catherine’s Monastery: https://stcatherines.mused.org/stories/29/manuscripts-at-st-catherines-monastery
- Shields in Ancient Greek Warfare: https://armsandarmor.mused.org/stories/10/shields-in-ancient-greek-warfare
Quire
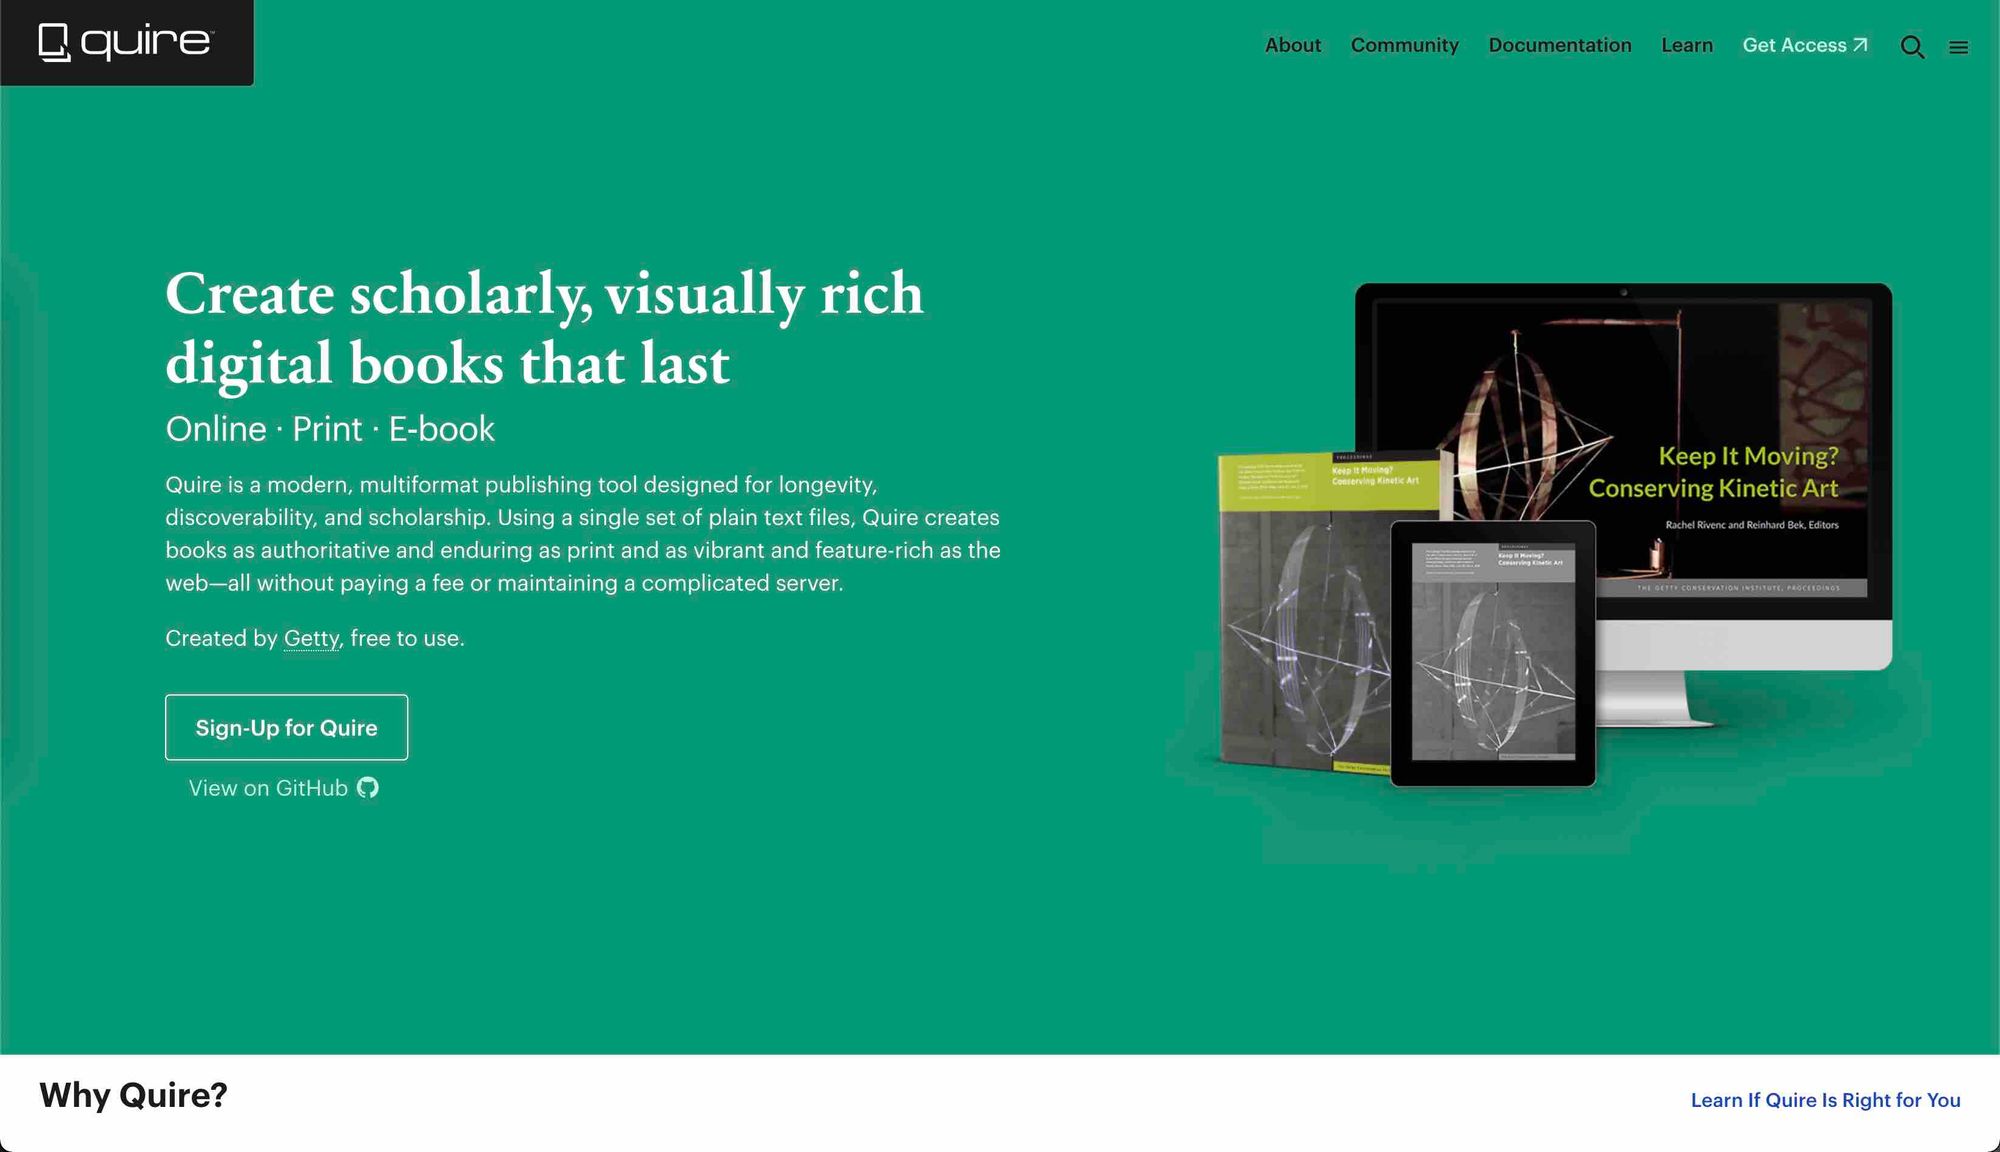
While not officially out of beta yet, you could apply to the Getty to try to be able to use Quire for your project. It allegedly creates digital books that are as long-lived as physical books (a bold claim!). But has the interactivity of a website. If that’s true, this is certainly a platform to keep an eye on for virtual storytelling! Their showcase features many museum catalogs, so that might be indicator of the type of use cases that Quire is suited for currently.
The digital books might be able to be read completely offline if you work somewhere where network connectivity is an issue.
Read more about Quire here: https://quire.getty.edu/
Examples:
French Paintings and Pastels, 1600–1945: The Collections of The Nelson-Atkins Museum of Art: https://www.nelson-atkins.org/fpc/
Materia: Journal of Technical Art History: https://volume-1-issue-1.materiajournal.com/
Highpoint Editions: A History & Catalogue, 2001–2021: https://highpoint-editions.netlify.app/
As this is a huge topic, I hope this short overview is useful for a quick intro to how many are incorporating visual storytelling into their exhibitions. Coming soon is how 3d content and virtual tours can fit into all of this. If there are other topics that you’d like to explore further, let me know in the comments–that’s all for now, GLAM-orous humans!
If this article was useful to you or inspiring in any way (or if you disagreed with my ideas so vehemently you want to be informed of when I write anything else so that you can disagree with them publicly before they gain readership unchecked), please sign up ✨ by entering your email ? at the bottom of this page, and more fascinating winged words composing GLAM-tech blog posts will arrive to your sweetly-crowded inbox.
1 Comment
Comments are closed.


Pingback: How to build a digital exhibition for your museum or heritage site in 2022: Getting Started, part 1 of 3 – Mused